Every Q4, thousands of retailers place the same bet. They stock up on whatever looked hot at the last trade show, then watch it either sell out by February or sit in the warehouse until clearance season. That gamble gets more expensive every year, and with fitness industry trends 2026 shifting faster than most sourcing calendars can keep up, guessing isn’t a strategy anymore.
This is a working reference for buyers who need actual numbers before committing budget. It covers which categories have real demand data backing them, what markup they support, who’s already supplying them at scale, and which “hot” products are becoming retail dead weight. If you’re building a 2026 purchase order right now, this is the breakdown to read before you sign off on it.
Smart Wearable & Connected Fitness Devices
The global smart fitness market is worth $99.12 billion in 2026 and on track to hit $213.71 billion by 2033 , a compound annual growth rate of 11.6% . Fitness trackers alone account for 45.9% of that. This category has moved past being a niche add-on. It's a core decision for what goes on your shelves.
Your buyers are data-driven consumers who track sleep and recovery, not just steps. That shift matters. Since 2020, sleep and recovery tracking has been the top priority, beating step counting. Your buyer persona should lean toward performance-focused adults aged 25 to 45 who will pay a premium for accurate biometrics.
What's driving demand? Roughly 70% of consumers now prioritize ECG, SpO2, and heart-rate monitoring when choosing wearables. About 40% of devices launching in 2026 include AI-enabled coaching features. Shipments back this up. Global fitness tracker shipments are projected at 192 million units in 2026 , up from 178 million in 2025.
Sourcing & Inventory Strategy
Restock quarterly. Hardware refresh cycles move fast, and holding too much inventory on last-gen devices kills your margin.
Markup runs 35–50% for mid-tier trackers. Premium AI-coaching devices can support 55% or more.
58.7% of smart fitness sales happen online in 2026. Retailers who pair physical inventory with e-commerce fulfillment see better sell-through.
One caution: Apple Watch alone commands about 30% of the smartwatch segment. If you stock third-party brands, make sure they integrate with the major platforms. Standalone ecosystems are a harder sell in 2026.
Berun Activewear – Custom Activewear Manufacturer for Retailers & Private Label
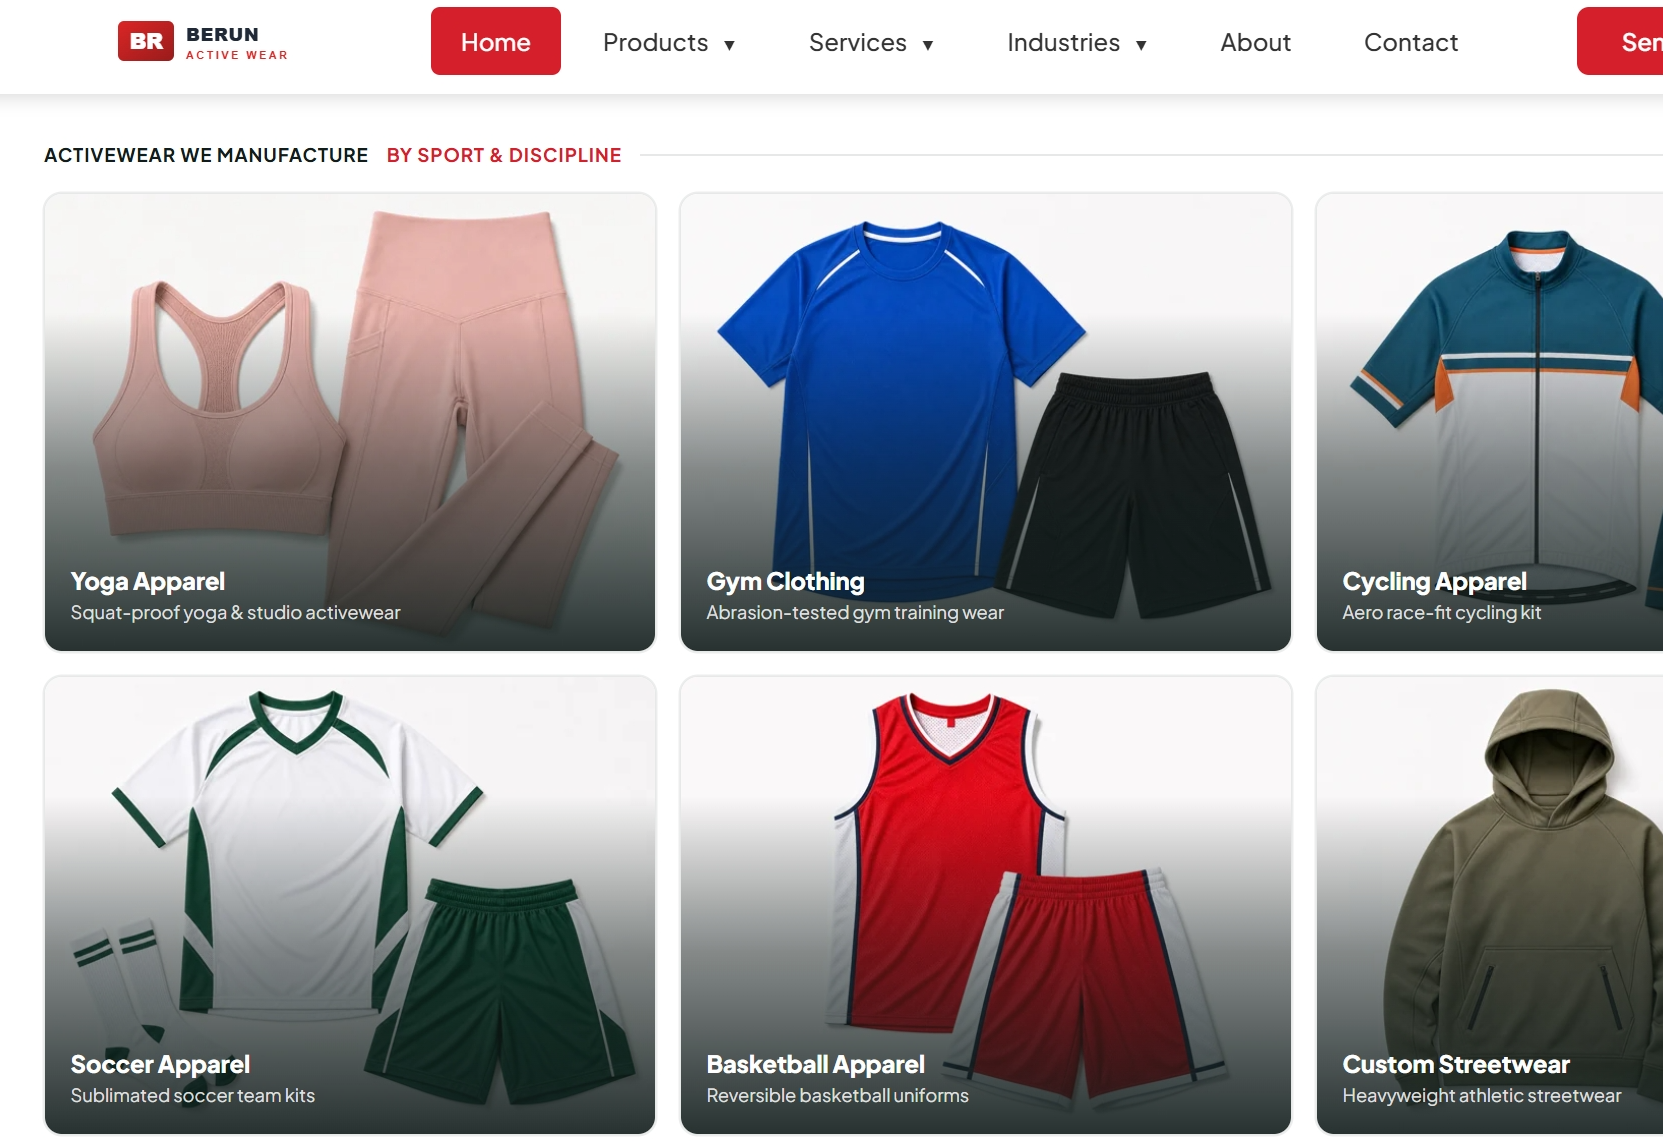
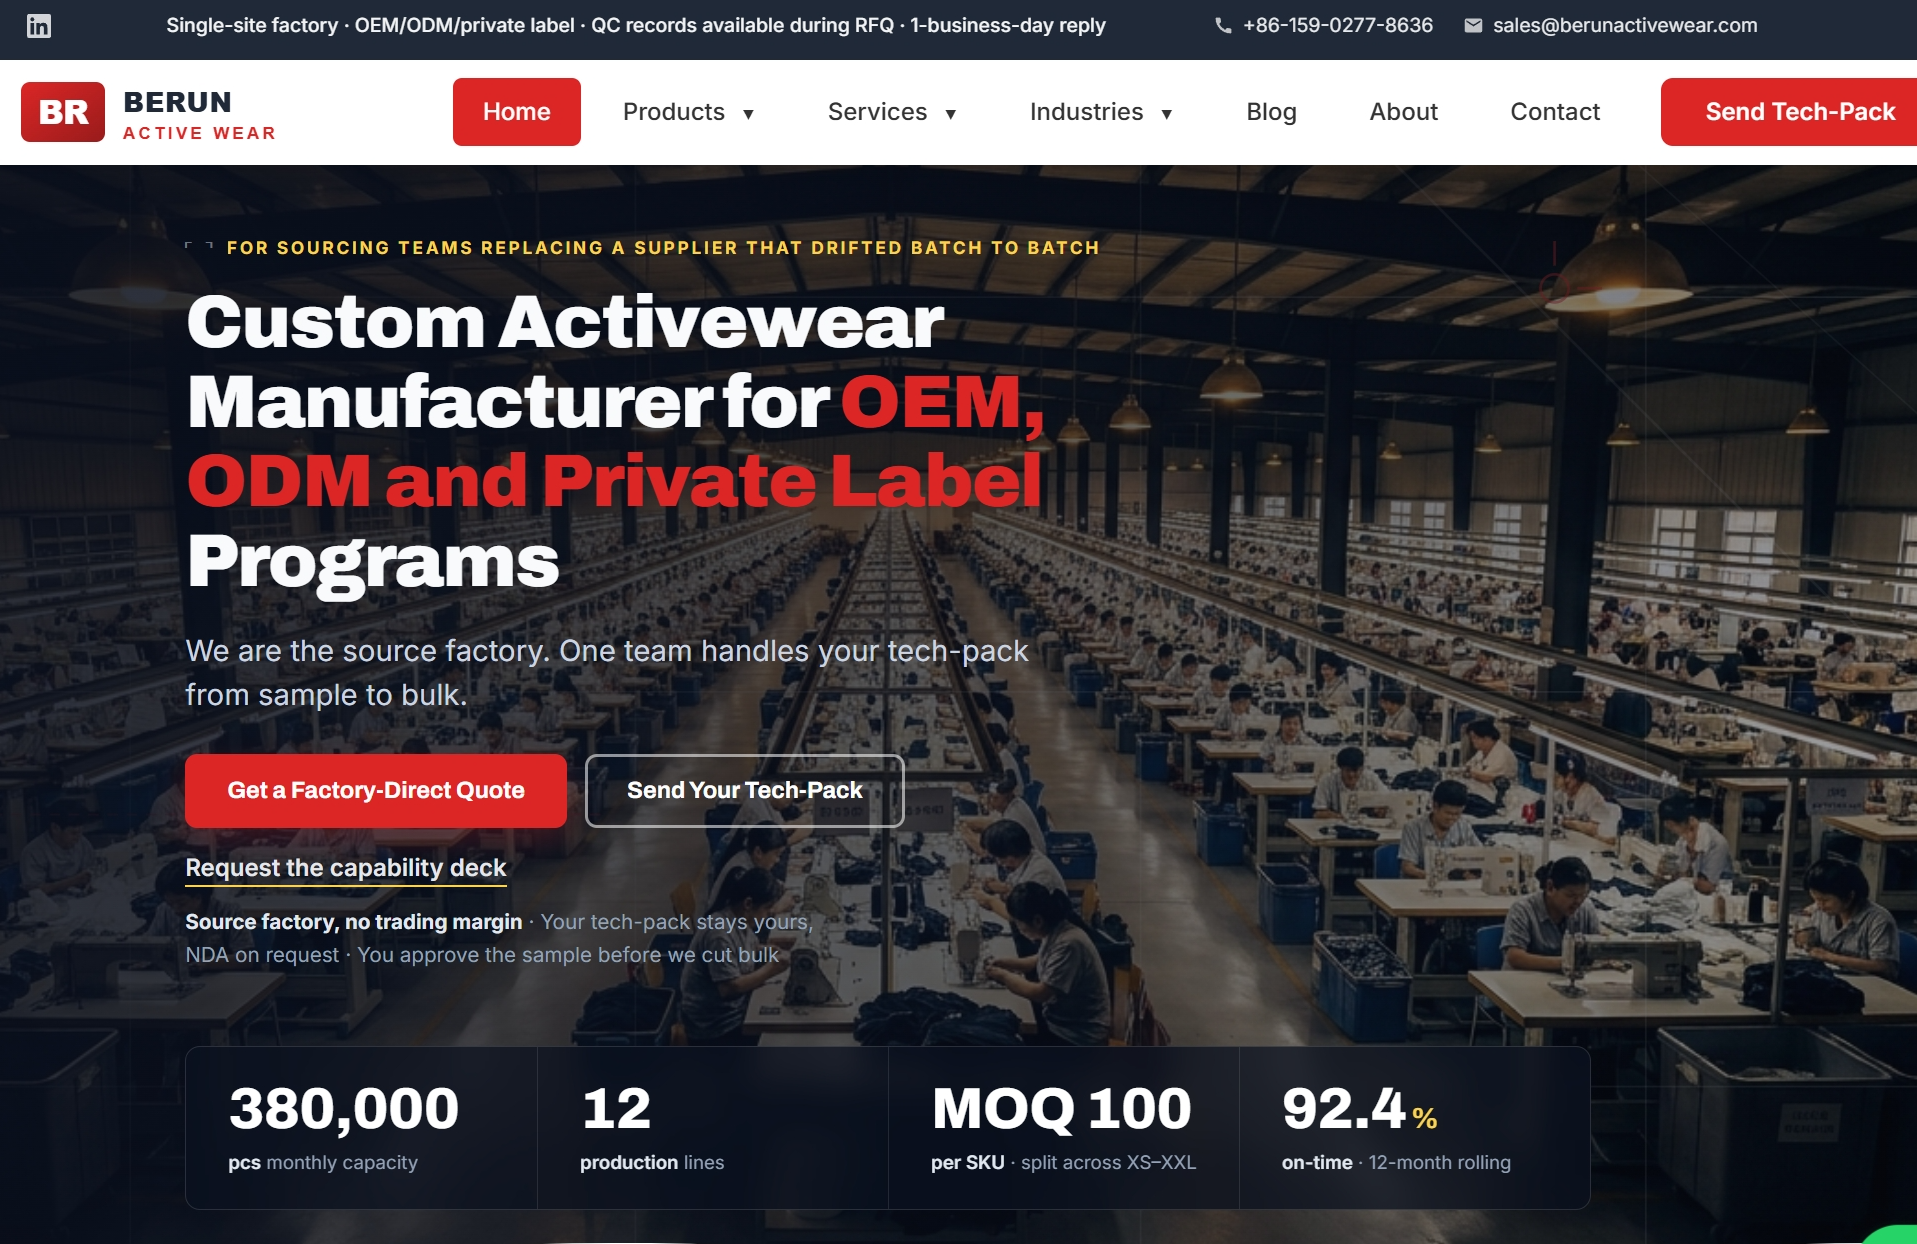
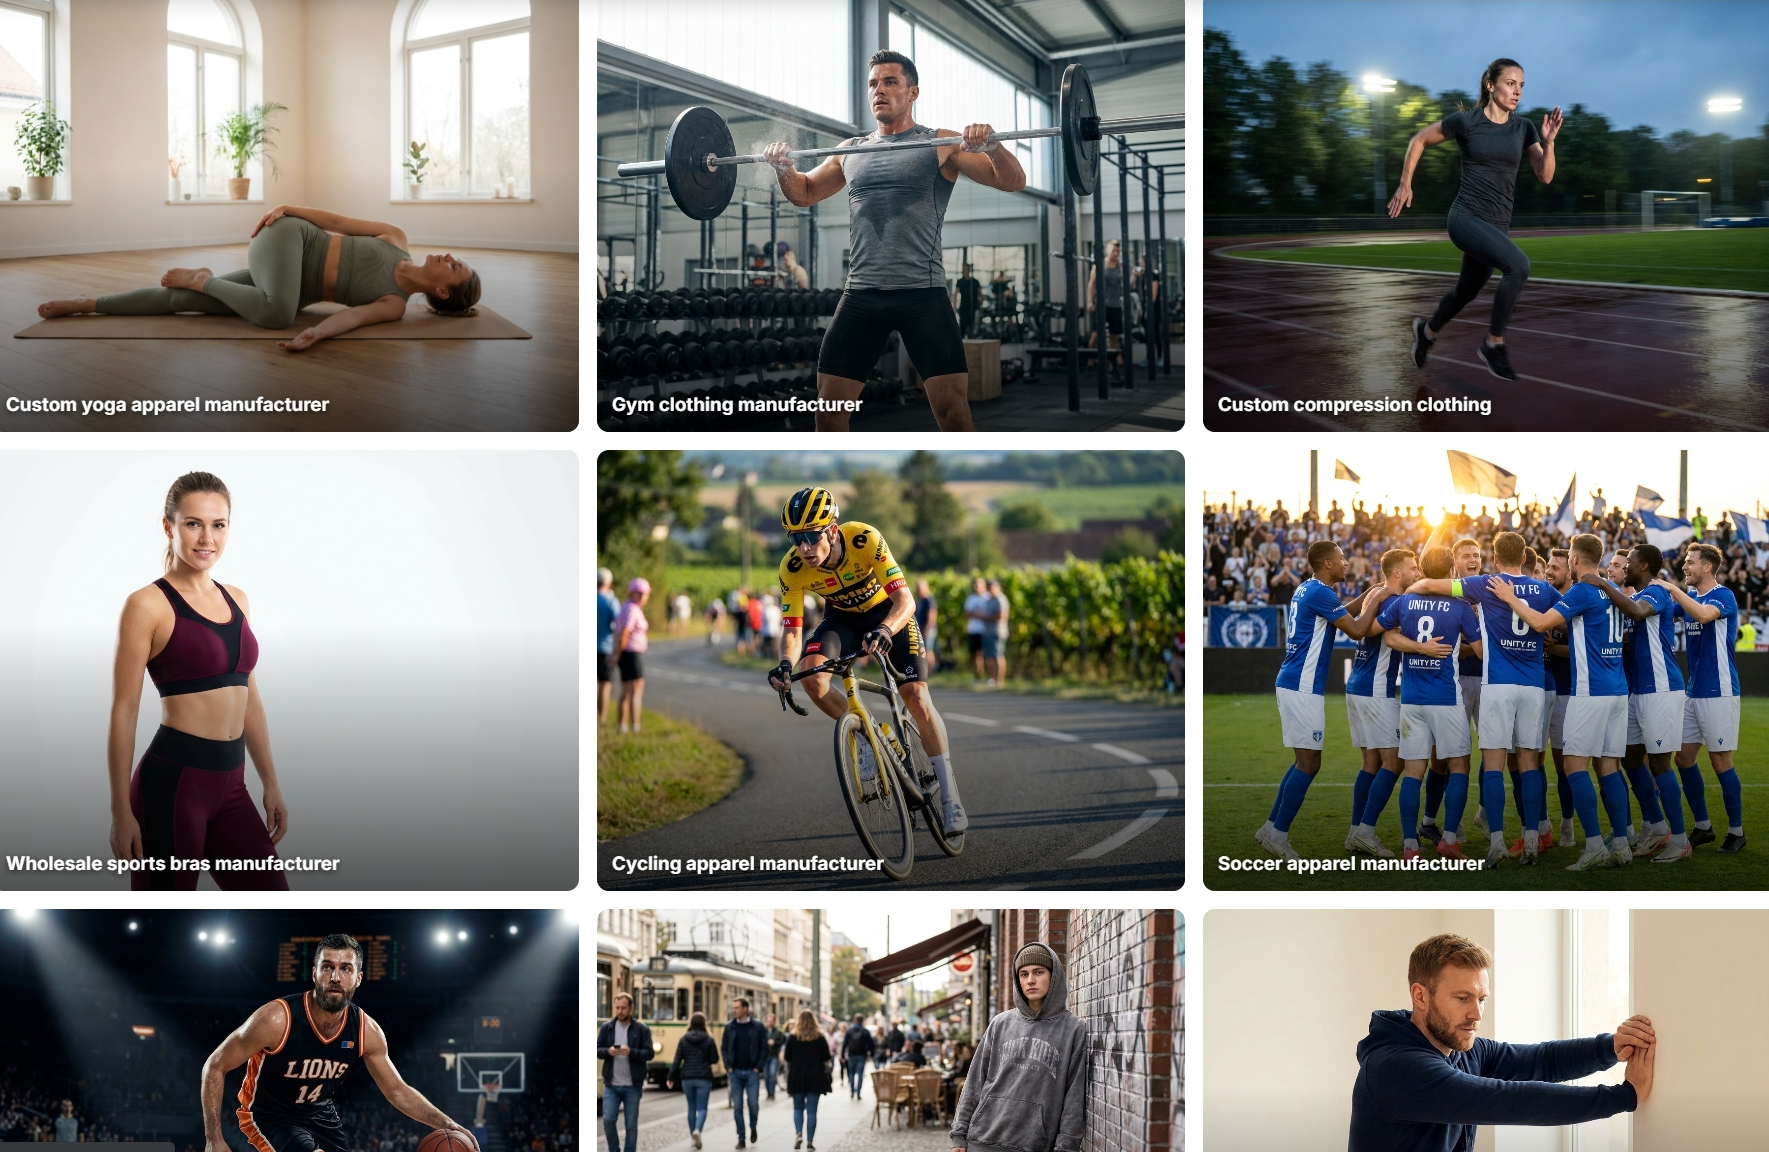
Sourcing wearables is only half the 2026 playbook. The other half is activewear wholesale trends, and this is where private label margins get interesting. Berunactivewear runs full-cycle OEM/ODM activewear production for retailers building their own performance lines: yoga wear, running apparel, cycling kits, team wear, sublimated jerseys, event uniforms. Technical sportswear built for buyers who want margin control instead of someone else’s brand markup.
Numbers That Matter for Buyers
MOQ : 150–200 pcs per color/style, manageable for startup to mid-scale DTC retailers testing new lines.
FOB pricing : $9–16/pc depending on fabric and complexity.
Lead times : Sampling in 5–10 days when fabric’s in stock. Bulk runs at 35–42 days (stock fabric) or 48–58 days (custom-developed fabric).
Fabric base : Nylon/spandex blends (75/25–80/20), wicking and anti-bacterial finishes, OEKO-TEX Standard 100 certified.
Compliance : BSCI participation, ISO9001 status pending confirmation.
How to Work the RFQ
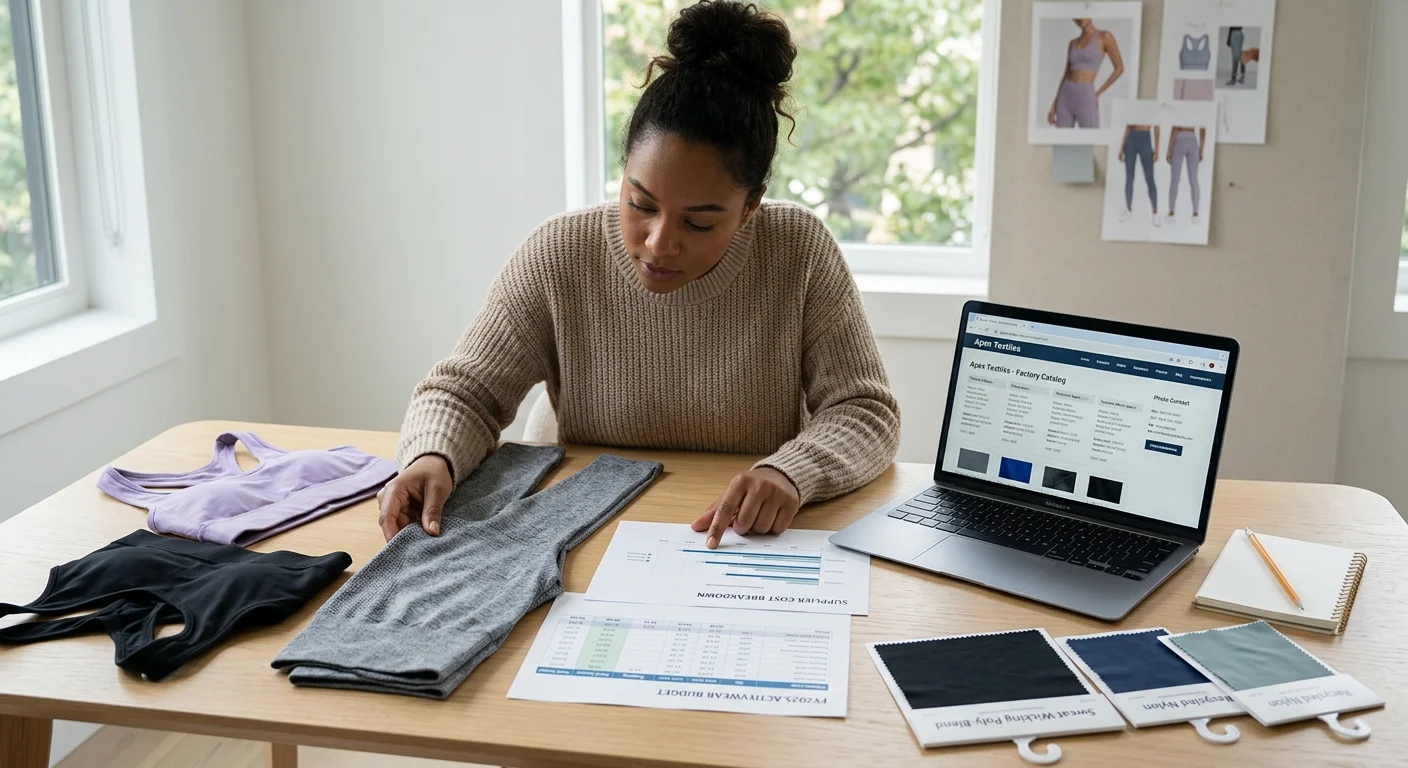
Shortlist no more than three activewear suppliers. Send identical tech-packs within a 48-hour window and compare who answers with specifics, not templates. Berun takes tech-pack reviews within one business day and flags fabric or construction issues immediately. That turnaround tells you a lot before you’ve committed a dollar.
Home Strength Training & Multi-Functional Gyms
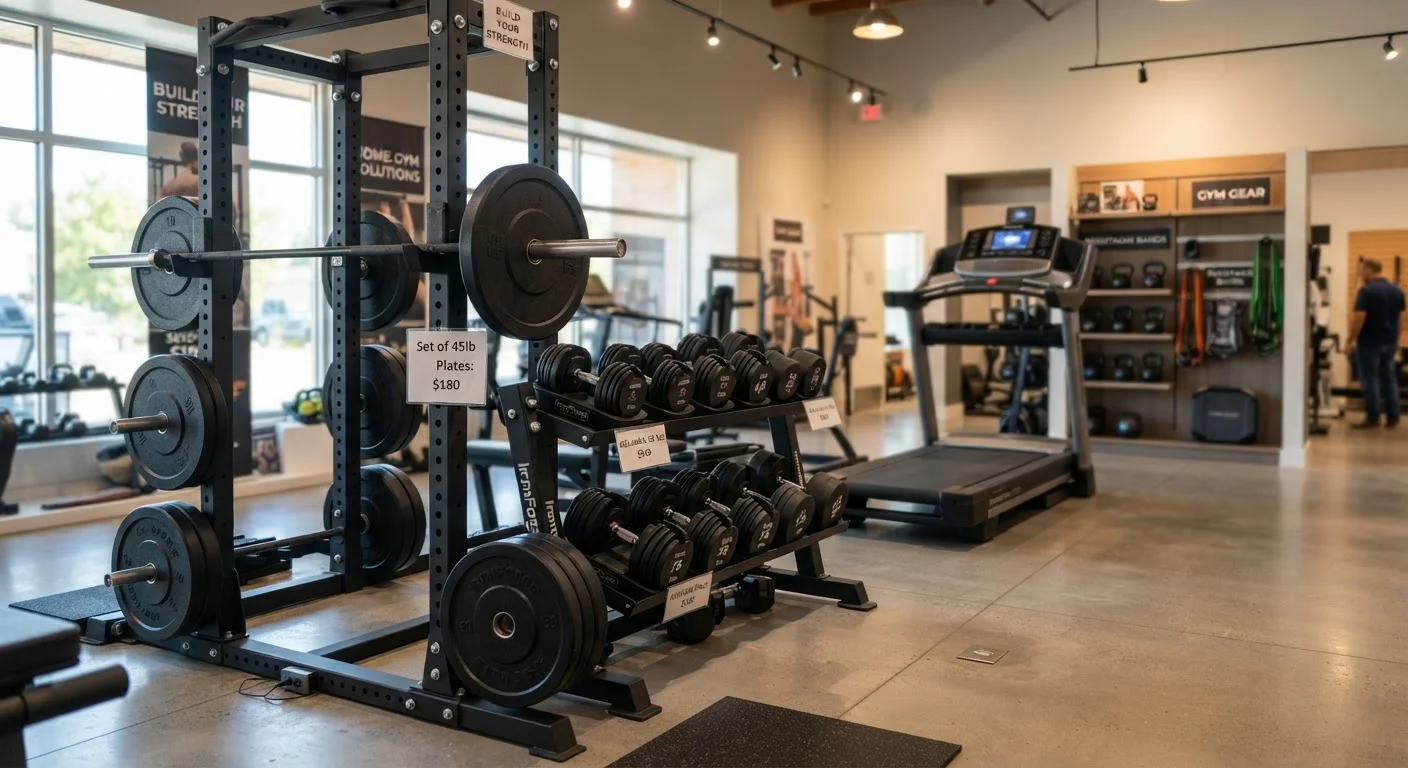
Weight racks are outselling treadmills in a category most retailers still price like it’s 2021. Home strength training now sits at $12.4–12.9 billion in 2025, with strength-specific equipment alone forecast to climb from $13.79 billion in 2026 to $18.88 billion by 2031, a 6.47% CAGR. It’s a structural shift in how people train.
Weights dominate at 43.2% market share, but racks and benches are the fastest-growing product line at 6.71% CAGR. That combination—dumbbells plus a rack setup—is your core buying signal for 2026.
Your buyer skews female (56.7%) and lands in the 26–35 age bracket at nearly 34% of the customer base. Convenience drives 51% of their at-home preference. Privacy matters too, at 20%. And 38.6% of these buyers spend under $500 per item, which tells you exactly where to price your entry-tier SKUs.
Sourcing & Inventory Strategy
Restock cycle : Semi-annual works better than quarterly here. Strength equipment doesn’t have the refresh churn wearables do.
Markup : 30–45% on adjustable dumbbells and benches; racks and cable systems support 40–50% given lower SKU turnover.
Channel split : Online is growing at 9.37% CAGR through 2031, outpacing offline. Stock lean in-store, heavier online.
Prioritize compact multi-gyms and adjustable dumbbells over single-use barbells. Space-conscious buyers want fewer pieces that do more.
Home Cardio Equipment (Treadmills, Stationary Bikes, Rowing Machines)
Treadmills have been the #1 most-searched fitness equipment term in 10 of the last 13 years. Retailers keep underpricing that buying signal. Cardio equipment overall accounts for 63.0% of the home gym equipment market by type in 2026, and treadmills alone drive more than 53% of total fitness equipment revenue. Search interest in cardio gear rose 72% between 2011 and 2023, spiking 71% in 2020. Lead your sourcing plan with cardio.
Smart, AI-connected treadmills and bikes are overtaking traditional models in the mid-to-premium tier. Buyers want hardware paired with software: real-time heart-rate zone training, automatic resistance adjustments, cloud-linked histories, multi-user profiles. The home fitness app market grew from $2.24 billion in 2023 to a projected $34.97 billion by 2030. That is an 11.3% CAGR fueling every connected treadmill, bike, and rower you stock.
Space is the other constraint shaping 2026 SKUs. Apartment dwellers want compact treadmills that fold to briefcase width, quiet motors, and cushioned decks over raw top speed. Rowing machines are gaining ground specifically because they pair low-impact conditioning with strength: the “smart treadmill or rower plus adjustable dumbbells plus kettlebells” combo is becoming the default at-home weight-loss stack.
Sourcing & Inventory Strategy
Price tier discipline : 38.6% of home fitness buyers spend under $500 per item. Stock entry-level compact walking treadmills at that ceiling, then layer smart bikes and rowers as the $500–$1,000 upsell.
Restock cycle : Semi-annual, aligned with strength equipment. Cardio hardware does not churn like wearables, but console software updates matter for shelf life.
Markup : 25–35% on entry treadmills; smart bikes and connected rowers with subscription-ready consoles support 35–45%, since recurring app revenue justifies premium pricing to your buyer.
Buyer profile : Women make up 56.7% of home fitness equipment users, with the 26–35 bracket at 33.8% of the customer base — the same core demographic driving strength equipment purchases. Cross-merchandise accordingly.
Prioritize sports clothing suppliers offering Bluetooth FTMS compatibility or Zwift/Peloton-style app integration. Standalone consoles with no upgrade path are the return-and-refund risk in this category.
Recovery & Rehabilitation Devices (Massage Guns, Inversion Tables, Stretching Machines)
Nobody pitches recovery gear the way they pitch smart rings at trade shows. That's a sourcing gap worth exploiting. The therapy equipment segment — massage guns, inversion tables, stretching machines — is tracking toward $10.3 billion by 2030 at a 5.3% CAGR , inside a broader rehabilitation equipment market valued at $16.96–17.7 billion in 2024 .
Home-care is where the growth is. Hospitals still hold 56.15% of rehab equipment share in 2025, but home-care settings are expanding fastest at 11.82% CAGR through 2031 . Rising musculoskeletal disorders, aging populations, and injury rates are pushing recovery tools from clinics into living rooms.
Split your buying by tier. Standard massage guns and basic stretching machines fit a 5–8% CAGR planning range. Smart, app-connected units — programmable stretch machines, motorized inversion tables, Bluetooth massage guns — track closer to 10–13% CAGR , backed by a 12.85% CAGR forecast for robotic and smart rehab systems through 2031.
Sourcing & Inventory Strategy
Regional weighting : North America holds 42.52% of global demand; Asia-Pacific is fastest-growing at 9.12% CAGR.
Restock cycle : Quarterly for smart/connected devices, semi-annual for standard units.
Markup : 30–40% on standard recovery devices; 45–55% on app-integrated, premium models.
Prioritize activewear wholesalers adding connectivity features — that's where the double-digit growth cluster lives.
Functional Training & CrossFit Equipment (Kettlebells, Battle Ropes, Plyo Boxes, Sandbags)
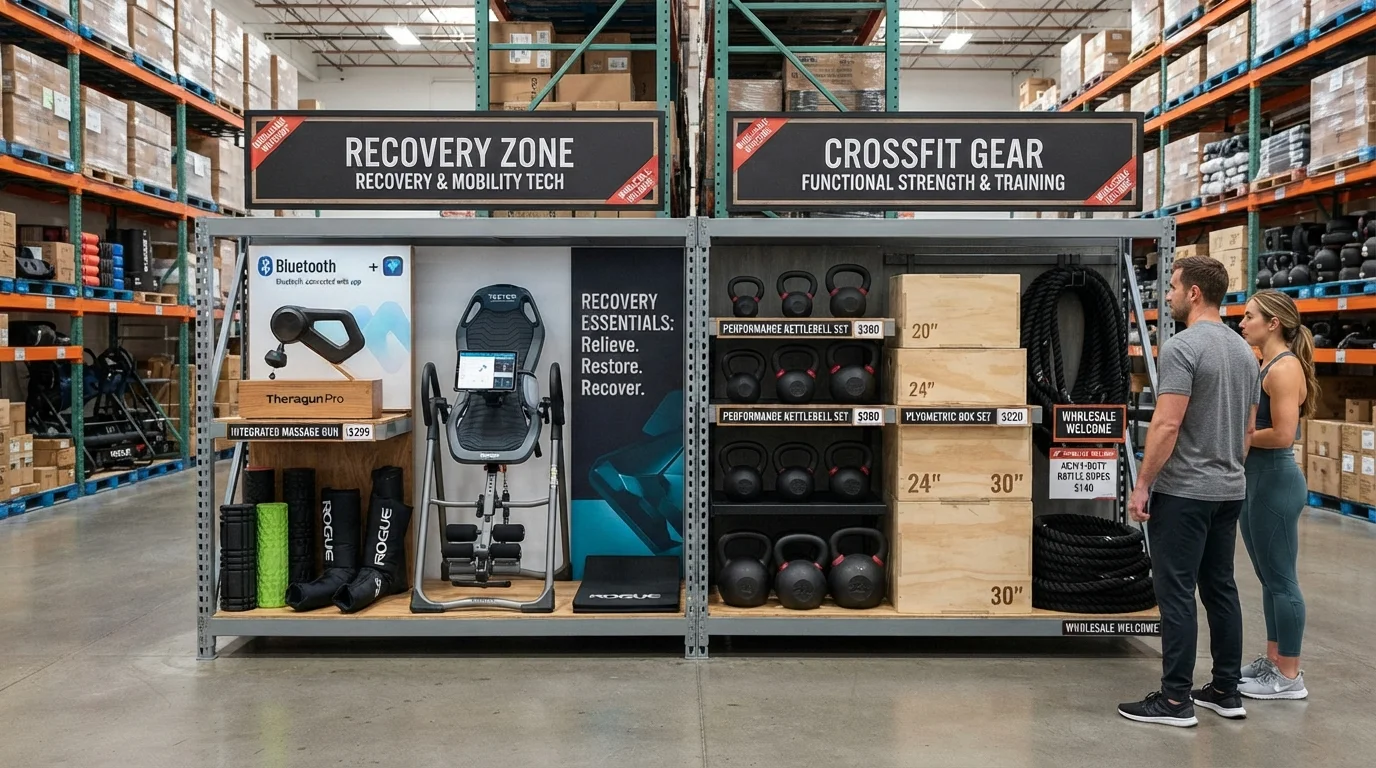
CrossFit boxes don’t buy equipment the way big-box gyms do. They buy in kits, and if you’re sourcing for this crowd, you need to think in kits too.
Kettlebells anchor the category. A starter set for a small box or home gym runs 16 kg, 24 kg, 32 kg for men, and 8 kg, 12 kg, 16–20 kg for women. Commercial boxes add “beasts” at 36–48 kg for advanced swings and carries. The industry rule of three is your inventory math: roughly 20 kettlebells support about 60 athletes a day across staggered classes. Look for cast iron or steel single-piece casting, powder-coat or rubberized finish, and weight tolerance within ±2%. Anything looser gets returned.
Plyo boxes come in three standard heights: 20" (women's Rx), 24" (men's Rx), 30" (competition). Many activewear suppliers now sell 3-in-1 versions covering all three orientations, which simplifies your SKU count. Plan roughly one box per 2–3 athletes for group WODs. Wood (18–21mm plywood) dominates; foam-core versions sell well to beginner-focused studios worried about shin injuries.
Sandbags and battle ropes fill out the kit as second-phase purchases. Stock 3–4 sandbag weight brackets (45, 75, 100, 150 lb) and 2–4 battle ropes at 50 ft, 1.5" diameter per location. Durability under drops, throws, and sweat matters more here than anywhere else in your catalog.
Activewear & Performance Apparel with Sustainable Materials
Recycled polyester carries 38.6% of the sustainable activewear market, worth $3.36 billion in 2025 alone. The broader category was valued at $8.7 billion in 2025 and is projected to hit $21.4 billion by 2034 , a 10.5% CAGR . Bottoms lead product demand at 34.2% share, and North America holds the largest regional stake, between 33.8% and 36.8% depending on the source. That's your activewear wholesale trends baseline for 2026.
Buyers should know these materials: recycled polyester, bio-based or regenerated nylon, recycled wool, organic cotton, hemp, and cellulosic fibers like Tencel/lyocell. Bio-based elastane is scaling fast — commercial production is tracking toward 200,000 tons/year by 2026 , with early large-scale fibers hitting a 70% renewable content benchmark .
Sourcing & Verification Checklist
You should demand GRS or RCS for recycled content, GOTS/OCS/USDA Organic for organic fibers, RWS for wool, and OEKO-TEX for chemical safety. For performance, aim for at least 85% certified recycled synthetics and at least 12% certified elastane for stretch-heavy pieces. Verify activewear factories through tier-1/tier-2 facility mapping, SA8000 or WRAP reports, and yarn-to-mill traceability. Test stretch recovery, shrinkage, colorfastness, seam strength, pilling, abrasion, and wash durability before you buy.
One warning: lululemon, New Balance, ASICS, and adidas have all reported double-digit increases in manufacturing emissions recently. Buyers pushing a "sustainable" story without supply-chain proof are taking a risk. Mono-material knits are gaining traction for this reason — simpler recycling, cleaner claims.
Gym Accessories & Essentials (Resistance Bands, Yoga Mats, Jump Ropes, Gloves)
Low ticket price, high shelf turnover. This category earns its space by volume. Every home-gym buyer eventually adds resistance bands, yoga mats, jump ropes, and gloves to their cart.
Yoga mats run $10–$30 in most retail markets. Resistance bands land in a similar range depending on resistance level. Jump ropes stay cheap and portable by design. The spec buyers check before purchase is a 6mm TPE mat with non-slip grip.
Day-one buyers grab a mat, bag, and bottle. Gloves and bands become add-on purchases 2–4 weeks later, once training habit sticks. That's your cross-sell window.
Sourcing & Inventory Strategy
For margin, sell a starter kit with mat, bands, rope, and gloves as one SKU. Bundling lifts average order value without raising unit cost. Markup of 40–60% is standard since unit cost is low and volume absorbs risk. Restock monthly. These are consumables: bands snap, mats wear thin, grip tape on gloves degrades. Work with a separate resistance bands bulk workout gear supplier and a yoga mats wholesale distributor rather than one generalist, because material quality differences (TPE vs. PVC, latex vs. fabric-wrapped bands) affect return rates.
This is volume-and-turnover retail math. Get the bundling and restock cadence right, and it becomes one of your steadiest inventory lines.
Categories Retailers Should Approach with Caution in 2026
Not every category deserves shelf space this year. Some are structurally weak, and no amount of clever merchandising fixes that.
Specialty retail is the biggest red flag. Forrester and Forbes project three U.S. specialty chains could file for bankruptcy in 2026, squeezed by high interest rates, online migration, and mass-retailer competition.
Tariff-exposed imports come next. Reuters puts global tariff impact at $21–22.9 billion in 2025, with nearly $15 billion more expected in 2026. Electronics, home goods, and general merchandise carry the most margin risk here.
Apparel, food, and wellness are being reshaped by GLP-1 drugs, per NRF. Old demand assumptions on sizing and consumption no longer hold.
High-return e-commerce categories face policy tightening. Forbes/Forrester expects two major global retailers to impose stricter return rules in 2026.
Search-dependent categories are exposed too. Traditional Google discovery is disrupting the funnel for keyword-reliant sellers.
Watch value-sensitive SKUs. Deloitte reports 70% of Americans are actively value-seeking, and 70% of retail executives call it structural.
Recommended Inventory Allocation Strategy for 2026
Category picks mean nothing without a system to allocate the actual units. Most sports retail inventory strategy failures come from dumping all your stock into locations based on last year's averages instead of this month's demand.
Segment your SKUs, keep a buffer, and let live demand signals drive placement.
A items (top 20% of SKUs, 70–80% of revenue, your smart trackers, connected treadmills, private-label activewear): stock at every active location with 30–45 days of node-level safety stock. Weekly counts, non-negotiable.
B items (next 30%, recovery devices, kettlebell sets): place only where regional demand share exceeds 35%.
C items (bottom 50%, slower accessories): consolidate to one hub, replenish in bulk.
Reserve 15–20% of inbound supply as an uncommitted safety pool. Don't pre-allocate it. That buffer absorbs regional spikes without triggering emergency reorders. Centralize visibility across your ERP, WMS, and POS systems so reallocation triggers fire when one location stalls and another surges.
Conclusion
Three categories stand out for 2026: smart wearables, home strength equipment, and sustainable activewear. Each has double-digit growth and buyer profiles that support a premium markup. Oversaturated categories like basic yoga mats should get a smaller share of your budget.
Smart allocation matters more than chasing every new product. Use the inventory ratios in this guide as a starting point, then stress-test them against your own sell-through data before placing bulk orders.
Pull your Q1 purchase orders, cross-reference them against this risk-tiered list, and reallocate at least 15% of your budget toward the categories with real growth receipts.