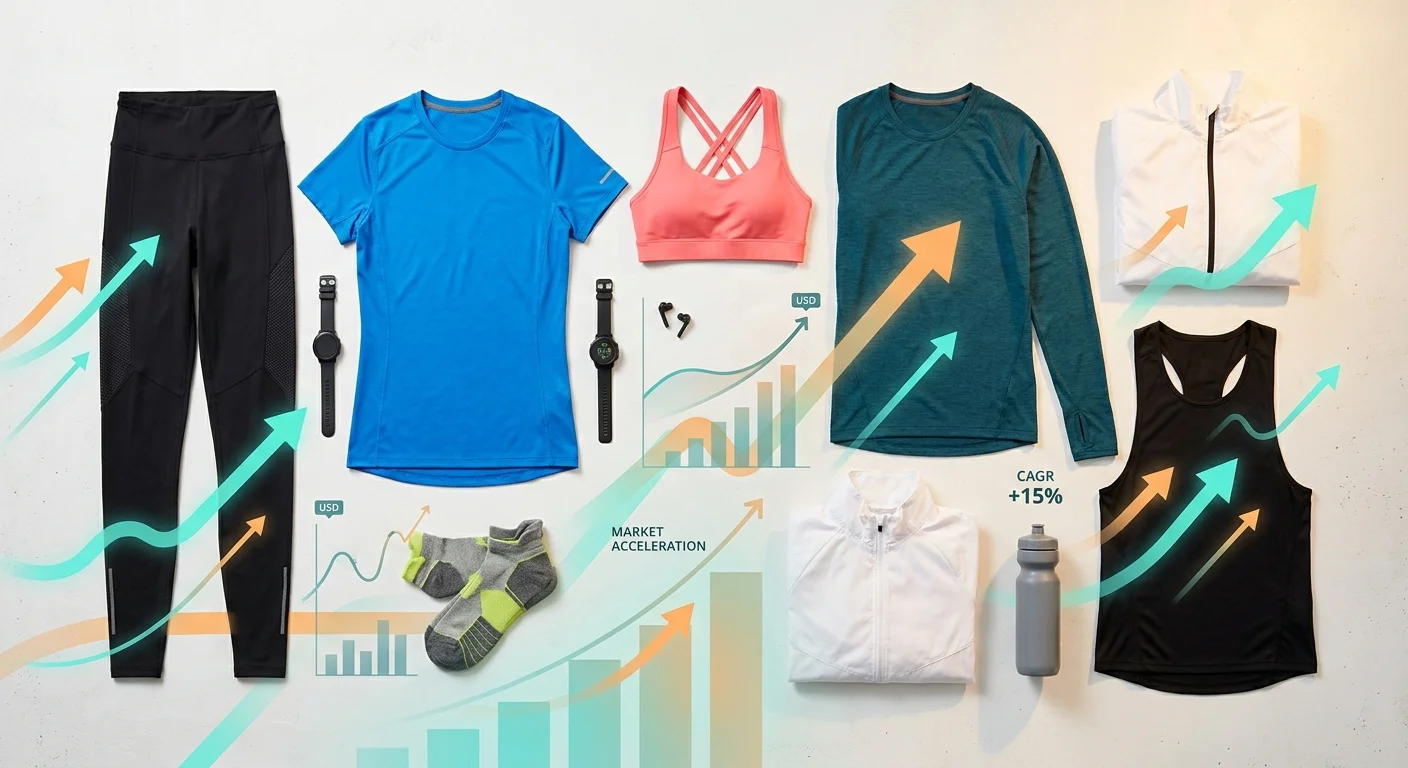
The athletic apparel market doesn't just grow — it compounds.
Most industry reports stop at the projected $500+ billion global valuation. But the real question is why it keeps accelerating. More to the point: which forces are doing the heaviest lifting?
The athleisure trend grabs most of the headlines. Below the surface, though, sits a far more complex mix — demand shifts, material breakthroughs, and structural market changes that most analyses skip past.
This isn't a market overview. It's a dissection. You'll get a layered breakdown of the demand-side, supply-side, and macro catalysts driving growth in athletic apparel — with data, brand proof points, and priority frameworks you can put to work.
Demand-Side Drivers: Consumer Behavior & Lifestyle Shifts
Between pandemic lockdowns and a post-restriction world eager to move again, consumers rewired how they think about clothing. Athletic apparel came out as the biggest winner.
This isn't a temporary attitude shift. It's a structural one.
From Need-Based to Lifestyle-Led Spending
Retail research firm Circana said it straight: consumers now spend on products "grounded in lifestyle passions." Wellness, functionality, and fashion-adjacent categories are among the clearest growth areas heading into 2026. For athletic apparel, this doesn't just mean higher volume. It means people open their wallets for a completely different reason than before.
The old purchase logic was simple. You needed a gym kit, you bought one. The new logic runs deeper and reaches further. Buying athletic wear has become an act of identity — comfort, self-expression, and a clear signal of a health-forward lifestyle. Leggings go to brunch. Hoodies go to the office. Technical base layers rotate into daily outfits. The gym wear market demand has extended well beyond the gym.
Circana describes this shift as a move from one-off demand spikes toward usage-and-replenishment patterns . Consumers come back again and again, rather than buying once and disappearing. That kind of repeat behavior is what builds durable category growth over time.
The Digital Behavior Lock-In
The numbers are hard to ignore. At the start of the pandemic, 24% of consumers did most of their shopping online. That figure jumped by 60% from that baseline — and it stayed elevated. McKinsey's consumer research calls these shifts "sticky" across major markets. The channel migration isn't going backward.
On top of that: 43% of consumers tried a new shopping method during the disruption period. Of those, 75% liked it enough to keep using it , and 37% switched to a different brand — with equally strong retention rates. For fitness apparel consumer behavior , the takeaway is clear. Brands that built strong digital experiences during that window didn't just survive. They locked in loyalty that has held firm.
Demographic Expansion Is Deepening the Market
Two structural forces are widening the addressable base.
First, urbanization and rising middle-class income in emerging markets — across Asia-Pacific in particular — are creating new groups of athletic apparel consumers. These buyers have disposable income, retail access, and growing exposure to global fitness culture. More urban density brings more gyms, more studio fitness, and more daily sportswear adoption.
Second, rising female fitness participation is expanding category depth in a real, measurable way. Sports bras, high-waist tights, low-impact training tops, and studio-to-street layering systems rank among the fastest-growing SKUs. Brands didn't create this demand. The demand was already building, and supply caught up.
Gen Z and Millennials add another layer. These groups shop through mobile-first paths, discover products through creator content, and connect with brand storytelling at a level older demographics don't. For brands built around the athleisure trend , this group isn't just a target audience. They're the amplification engine.
What to Watch
To track demand-side health in this market, focus on these signals:
Repeat purchase rate across training tops, compression gear, and running apparel
Lifestyle vs. performance split in category revenue mix
Women's fitness and studio apparel growth trajectory
Social commerce conversion from influencer-driven discovery
Mobile-first purchase share as a percentage of total channel mix
The demand side of this market isn't riding a fitness fad. Consumers have redefined what athletic clothing is for . They've built new buying habits that show no real signs of reversing. This market is being rebuilt from the ground up — and the foundation looks solid.
Supply-Side Drivers: Material Innovation & Manufacturing Evolution
Fabric doesn't lie. Put on a pair of tights that stay put through a deadlift, wick sweat through a HIIT circuit, and still look clean at a coffee shop after — that's not luck. That's engineering.
Performance fabric technology has become one of the most important supply-side forces in athletic apparel. The shift from basic cotton-poly blends to moisture-wicking, quick-dry, breathable knit structures paired with 4-way stretch elastane and spandex blends isn't just cosmetic. These constructions improve fit retention, extend garment lifespan, and drive repeat purchases. A product that performs earns replenishment. A product that fails gets returned and forgotten.
From Linear Production to Lifecycle Thinking
Manufacturing in this category is going through a structural reset. The old model was simple: source inputs, cut fabric, ship product, move on. The new model centers on sustainable manufacturing — a framework that ties together economic, environmental, and social accountability across the full product lifecycle.
Athletic Clothing Manufacturers now work with what the industry calls the 6Rs: Reduce, Reuse, Recycle, Recover, Redesign, Remanufacture . This isn't idealism. Major retail buyers and institutional partners now treat it as a baseline compliance requirement . Sustainability has moved from a marketing claim to a procurement standard.
Material sourcing reflects this shift too. rPET, organic cotton, and bio-based fibers are replacing virgin polyester in forward-thinking supply chains. Brands are also adopting low-water dyeing and closed-loop processing methods. In high-income markets, this carries real pricing power — sustainable athletic wear commands a 10–20% price premium of activewear where eco-credentials are a genuine purchase driver.
Precision Engineering and Smart Finishing
The technical edge goes deeper than fiber choice. Consider what these construction methods actually deliver:
Seamless knitting, flatlock stitching, and body-mapped paneling cut friction points, improve heat management, and lower return rates
Silver-ion antimicrobial finishes extend wear cycles between washes — a real benefit for consumers who train every day
Laser-cut vents give targeted breathability without weakening the garment's structure
Brands that combine performance textiles + sustainable inputs + modular cut-and-sew capacity hold the strongest supply position in the market. Industry 4.0 tools — AI-driven inventory planning, IoT-enabled quality control, blockchain traceability — are making that edge even harder to close.
The supply side isn't just supporting demand. It's building it.
External Catalysts: Digital Commerce & Macro Infrastructure
The infrastructure doing the heavy lifting never gets credit in the headline number.
Demand-side passion and supply-side innovation set the stage. But the digital commerce architecture underneath decides how fast — and how far — this market can run. Three structural catalysts are driving that right now.
E-Commerce Has Repriced the Channel Mix
Online penetration in sports apparel already exceeds 25–30% in mature markets. It over-indexes against total apparel because athletic brands built DTC muscle before others did. Nike and Adidas both set public targets of 50%+ of total revenue from digital and direct channels — up from 20–30% pre-pandemic. That isn't a campaign goal. It's a full business model reset.
The operational payoff is concrete. E-commerce removes shelf constraints. A single activewear style can carry 20–40 size and color combinations — a long-tail assortment no physical store can stock. Full-assortment visibility, combined with rich media (360° views, video try-ons), lifts apparel conversion by 10–30% compared to static product pages. For technical sportswear, where function needs to be seen to be believed, the lift goes even higher.
BOPIS and omnichannel inventory tools add another layer on top of that. Showing real-time local availability at checkout pushes e-commerce conversion up by 10–20%+ . Total sales lift by 2–6% . Those numbers compound hard at category scale.
Social Commerce Compressed the Funnel
Discovery-to-purchase used to take days. On TikTok and Instagram, it now takes minutes . Native checkout, shoppable Reels, and in-video product links collapsed the traditional funnel into a single scroll. For emerging athletic labels, social commerce can represent 30–70% of early-stage revenue before any marketplace or wholesale activewear expansion starts.
The influencer layer makes this a structural shift, not a lucky accident. Mid-tier fitness creators — 100K to 500K followers — consistently drive hundreds to low thousands of orders within hours of a content drop. Viral gym aesthetics can spike order volume 5–10x baseline in short windows. You get trackable, scalable demand generation that replaces traditional ad spend with community momentum.
DTC Economics Changed the Math
Wholesale economics of activewear leave brands with 15–25% gross margin after retailer discounts. DTC flips that — premium athleisure brands consistently clear 60–70%+ gross margin on direct sales. That margin gap funds faster iteration, better product content, and first-party data that builds value over time.
The data advantage is the least visible edge, but also the most durable. Purchase history, browse behavior, abandoned carts, and loyalty engagement feed size curves by region, personalized recommendations, and lower CAC over time . These infrastructure advantages get stronger with every transaction.
The digital commerce layer isn't just supporting sports clothing e-commerce growth. It's accelerating it — building the structural conditions that make athletic apparel one of the most defensible growth categories in global retail right now.
Cross-Factor Interdependence & Contribution Weight Analysis

Three forces are building this market. But they don't work in parallel — they work through each other.
Demand, supply, and external infrastructure don't act as separate levers. They interact, amplify, and push each other forward. The total growth story is far bigger than any single factor can explain. Knowing how these interactions work separates a useful market analysis from a list of talking points.
The Weighted Foundation
Start with contribution weight — how much of total market growth each factor actually drives.
The breakdown looks like this:
Demand-side drivers (~45%) : Athleisure normalization carries the heaviest load at 25–30% of total growth. Fitness participation volume adds another 15–20% . These two alone make up close to half the market's upward momentum.
Supply-side drivers (~35%) : Performance fabric premiums — moisture-wicking, compression, 4-way stretch — contribute 15–20% through steady ASP uplift. Sustainable material scaling adds 10–15% , driven by SKU refreshes and product mix upgrades as recycled and organic inputs move from niche to standard.
External catalysts (~20%) : E-commerce infrastructure accounts for 10–12% . DTC margin optimization adds 8–10% — smaller in volume, but outsized in profit impact.
These weights are not equal. That gap matters a great deal for how brands should allocate investment.
Where Factors Collide and Compound
The real insight isn't the individual weights. It's the cross-factor multiplier — what two strong drivers produce together .
Performance fabric × DTC distribution is the clearest case. A high-performance moisture-wicking product sold through sportswear wholesale earns 15–25% gross margin. The same product sold direct-to-consumer clears 60–70% . The combined per-unit value multiplier sits at 1.38–1.75× versus either factor alone. Lululemon built its entire margin architecture on this exact pairing — technical product commands the premium, DTC captures it.
E-commerce infrastructure × athleisure normalization produces a different kind of compounding. Digital platforms expand SKU breadth 5–10× beyond what any physical retail footprint can hold. Algorithmic recommendation systems then lift repeat-purchase rates by 10–30% . The combined long-run buyer-value multiplier lands at 1.3–1.4× for high-engagement cohorts. Gymshark's rise was this equation in action — a lifestyle-forward product range, powered by a platform built for discovery and repeat buying.
Sustainable materials × demographic shifts creates the third major interaction. Over 50–70% of Gen Z consumers in apparel surveys prefer brands with credible ESG positioning. They show a clear willingness to pay a 5–10% price premium for it. Sustainable athletic wear credentials aligned with Gen Z values drive stronger retention and higher LTV — the combined loyalty multiplier reaches 1.2–1.3× for ESG-aligned segments.
Elasticity Is Not Uniform
Headline growth numbers hide one key fact: different product tiers respond to economic pressure in very different ways .
Budget athletic apparel — basic polyester, entry-level pricing, price-sensitive buyers — carries income elasticity above 1.2–1.5 and price elasticity of –1.5 to –2.5 . In a downturn, volume can drop 15–30%+ . Discounting can reach 20–40% off list just to clear stock.
Technical and sustainable athletic wear behaves in nearly the opposite way. Income elasticity falls to 0.5–0.9 . Price elasticity tightens to –0.3 to –0.8 . In moderate recession stress tests, volume decline holds within 0–10% . Consumers treat these products as health investments, not discretionary spending. That mindset is tough to shake, even under real financial pressure.
The point is clear: brands operating in performance fabric and sustainable athletic wear aren't just chasing higher margins. They're building demand that holds up far better when conditions get hard.
The forces driving this market aren't just additive. They're multiplicative — and the brands that know which combinations to stack are the ones pulling ahead fastest.
Brand Execution Micro-Cases: Capitalizing on Growth Vectors
Three companies. Three different playbooks. One shared instinct — find the growth vector that fits your structure, then push hard on it.
Lululemon, Gymshark, and Nike each pulled a different lever from the same market. What sets them apart isn't that they spotted the opportunity first. They built execution systems sharp enough to turn it into lasting commercial results.
Lululemon: Fabric as a Margin Strategy
Lululemon didn't just sell premium athletic wear. It built real reasons for customers to pay more — and return sooner.
The core mechanism is proprietary fabric platforms. Nulu, Everlux, Luon, Nulux — each targets a specific use case:
- Nulu → yoga
- Everlux → high-sweat training
- Nulux → running
- Luon → everyday wear
Each carries distinct technical credentials. Each supports multiple SKUs. This isn't standard product development. It's lifetime value architecture built into textile R&D .
The numbers tell the story. Women's core leggings sit in a price band of USD 88–128 — about 2–3× the mass-market equivalent. Gross margins top 55% , which is 10–15 percentage points above most legacy athletic brands. DTC mix sits at 70–80% of total revenue , versus about 40% for Nike. That margin gap funds the rest of the engine.
The retention system runs underneath all of it. Lululemon locks in fit blocks across popular silhouettes. It offers multiple inseam lengths — often 25"/28"/31" — with consistent waist-hip grading. The payoff: repeat purchases need no re-fitting . Customers already know their size. An email drop or ambassador post goes straight to a cart add. No friction.
Limited color drops on proven silhouettes — Align, Wunder Under — create a sense of scarcity. No new pattern development costs. Full-price sell-through holds. The discounting cycle that eats most apparel brands alive? It doesn't touch Lululemon.
The growth speaks for itself — a sustained mid-teens to >20% CAGR with stable margins. That's what you get from stacking fabric premiumization, DTC capture, and predictable replenishment into one compounding system.
Gymshark: Social Infrastructure as Distribution
Gymshark built a GBP 400m+ revenue business in under a decade. No athletic clothing wholesale to speak of. No owned retail to speak of. The entire growth thesis comes down to one idea: micro-influencers are a cheaper, more effective distribution layer than traditional channels.
The execution is tight. A global network of fitness micro and mid-tier creators — across Instagram, TikTok, and YouTube — gets seeded with product and activated through affiliate and sponsorship deals. Content shows up inside gym routines, transformation stories, and "outfit of the day" posts — not ad slots. The product stays in context. The audience trusts the person showing it.
Drop cadence ties the system together. Collections launch with:
- Countdown posts
- Try-on hauls
- Influencer top-pick roundups
- In-platform shopping on Instagram and TikTok Shop
Discovery-to-checkout happens inside one scroll session. For a Gen Z audience aged 18–30 shopping on mobile, every barrier between intent and purchase drops away.
Manufacturing matches this pace. Small initial runs go out first, calibrated against early social signals. Items that spike get rapid replenishment. Lead times shrink from industry-standard months down to weeks. Inventory risk falls. Speed to trend rises.
Skipping activewear outfit wholesale means Gymshark keeps the full retail-to-cost spread. That saved margin flows back into more content, faster product cycles, and lower customer acquisition costs over time. The outcome: global reach into North America, Europe, and Asia-Pacific with near-zero retail capex . Localized influencer cohorts and cross-border e-commerce logistics do the heavy lifting.
Nike: Data Infrastructure as the Real Moat
Nike's edge isn't a single product or channel move. It's a data lake with a membership layer sitting on top .
Nike Direct — Nike.com, the Nike app, SNKRS, and owned stores combined — now drives more than 40% of total revenue , up from the low-30s just a few years back. The gym clothing wholesale still exists. But the shift toward direct is deliberate. D2C gross margins run several hundred basis points above wholesale . Every percentage point of mix shift changes the margin profile of the whole business.
The SNKRS app shows that dynamic at its sharpest. Limited-edition releases, shock drops, and member-exclusive access create appointment-based demand spikes . Every draw, every purchase, every near-miss generates a behavioral signal — all trackable by SKU, geography, and customer segment. Unified membership across Nike apps and stores feeds that data into:
- Personalized product recommendations
- Dynamic inventory allocation by store and region
- Retargeting campaigns built on actual sport behavior — not just age or gender
The sustainability layer adds a different kind of staying power. Nike's Move to Zero program puts recycled polyester into core performance lines. Some running and football kits hit 50–100% recycled content while still meeting full performance benchmarks. Price points hold . No discount penalty for sustainable variants. Recycled materials at premium prices means the sustainable line's margin profile matches the standard one — so scaling it makes financial sense, not just brand sense.
The pattern across all three is clear. Each brand matched its growth vector to its structural strengths — product premiumization, social-native distribution, or data-driven DTC scale. Then it built an execution system that made that vector compound over time. Growth vectors don't deliver results on their own. They need this level of precision to turn market opportunity into real commercial separation.
3–5 Year Strategic Priority Matrix for Athletic Apparel Markets
Every market splits into layers over time — what keeps growing, what takes off under the right conditions, and what is running out of road. Athletic apparel is no different. The 2025–2029 data is clear enough to act on now.
Here is how the priority tiers break down.
Tier 1: High Priority — Sustain and Dominate
The athleisure segment sits at USD 422B in 2025. It is projected to reach USD 892.5B by 2033 at a 9.9% CAGR. That is not a niche play. It is the structural center of the entire market. Yoga apparel adds another USD 21B in volume by 2029. running apparel approaches USD 70B in the same window. Women's activewear is outpacing the category average across every major geography.
What this means in practice:
Core revenue architecture should center on athleisure and performance training. These two categories drive both volume and gross margin at the same time.
SKU strategy works best with fast-refresh capsules built around fit and fabric feel. Stack them on top of steady core items — black leggings, sports bras, training tops — that sell on reliable repeat cycles.
Fabric R&D needs capital now. Focus on moisture-wicking and 4-way stretch base layers, seamless knitting, and lightweight compression. Refresh these on an 18–24 month cycle , not once a year.
DTC buildout is non-negotiable. Loyalty programs, unified customer data across web, app, and physical touchpoints, and BOPIS integration are baseline infrastructure for the 2025–2028 window.
Some brands own proprietary knit structures or finishing technology — anti-odor coatings, cooling blends, body-mapped compression panels. Patent protection is worth pursuing for those. IP holds a price premium far better than marketing spend does.
Tier 2: Medium Priority — Build and Accelerate
Three areas belong here: sustainable materials , smart textiles , and emerging market e-commerce . None lead revenue today. All three are growing faster than the broader market on a 5-year horizon.
Sustainable materials are the closest to commercial scale. Consumers in the EU and urban Asia already pay a 5–10% premium for brands with real sustainability credentials. Industry leaders are targeting 50%+ recycled content in core lines by the early 2030s . Lock in multi-year rPET and bio-based nylon supply partnerships now — before demand tightens availability. Brands that do this secure a real cost and sourcing edge by 2027.
Smart textiles are still a small base. Still, pilot investments in running tops and recovery wear with integrated sensors are worth testing at limited scale in 2026–2027 . The key rule: co-develop with wearables partners instead of building capabilities in-house. Set hard attach-rate thresholds before committing to full scale.
Emerging market localization is the third area. China, India, and Southeast Asia are the fastest-growing regions for sports-inspired clothing. Social commerce in China already holds a double-digit share of online fashion sales . Live-shopping events, creator capsules, and limited-edition drops convert faster than standard product pages in these markets. Regional fulfillment infrastructure and localized UX — sizing grids, local payment methods, country-specific creator partnerships — are the levers that move conversion the most.
Tier 3: Low Priority — Exit or Reallocate by 2027
Wholesale-heavy models built on cotton-heavy, non-technical, generic gym wear carry the most risk in this market. No performance value proposition means these SKUs compete on price alone — and fast fashion wins that fight every time.
The structural pressures are clear:
Markdown rates and inventory write-offs run higher for non-technical seasonal ranges
E-commerce return rates exceed 20–30% for generic, ill-fitting products
Wholesale dependency cuts pricing control and squeezes margins further with every retailer negotiation
The playbook for this tier has two phases. 2025–2026 is diagnostic work — cut SKUs by profitability, flag bottom-decile performers, start reducing exposure. By 2027 , the structural shift should be done: phase out or license the lowest-margin non-technical collections, redirect factory capacity toward technical fabrics, and rebalance channel mix toward a 40–60% DTC share — where leading brands are already sitting.
Marketing spend follows the same logic. Pull budget away from price-driven wholesale promotions. Redirect it toward product storytelling in performance and athleisure — the categories that build lasting commercial value over the next five years.
Priority Matrix Summary
Priority Tier | Key Growth Factors | Strategic Implication | Investment Window |
|---|---|---|---|
High — Sustain & Dominate | Athleisure USD 422B→892B, 9.9% CAGR; sports apparel 4.4% CAGR; yoga +USD 21B; running ~USD 70B by 2029; women's outgrowing category | Core revenue architecture; fabric R&D DTC buildout; IP protection on proprietary constructions | 2025–2028, sustained |
Medium — Build & Accelerate | rPET/bio-fibers (+5–10% consumer premium); smart textiles above-market CAGRs; APAC/Middle East e-commerce growth; social commerce double-digit share in China | Layer on top of core portfolio; lock in sustainable supply chains; pilot smart textiles; localize emerging market channels | 2026–2029 |
Low — Exit or Reallocate | Cotton-heavy wholesale gym wear; generic unbranded basics; single-channel brick-and-mortar; returns 20–30%+ on poorly fitted SKUs | Prune SKUs, exit lowest-margin lines, rebalance channel mix toward DTC | Diagnostic by 2026; structural exit by 2027 |
The matrix is not a forecast. It is a capital allocation decision — where to concentrate resources as markets move at different speeds. Brands that put their heaviest investment behind Tier 1, build focused capability in Tier 2, and cut Tier 3 exposure fast will hold a much stronger competitive position by 2029. Those that spread investment across all three equally will not.
Conclusion
The athletic apparel market isn't growing because of luck. Multiple forces are all pushing in the same direction at once.
The brands winning right now aren't reacting to one trend. They're sitting at the crossroads of three major shifts: changing consumer identity, material science breakthroughs, and digital infrastructure that didn't exist ten years ago. That combination isn't accidental. It's built into the structure of the market itself.
The real question was never whether this market grows. It's which specific mix of factors fits your context — your customer, your resources, and your execution capacity. That answer looks different for entrepreneurs sizing up entry, investors projecting returns, or analysts writing their next report.
The athleisure trend and the shifts in fitness apparel consumer behavior covered throughout this piece aren't short-term tailwinds. They reflect a deeper cultural shift in how people see themselves and what they wear every day.
So don't just save this framework for later. Put it to work against your actual business decisions. The market keeps moving. You either move with it — or you're always catching up.