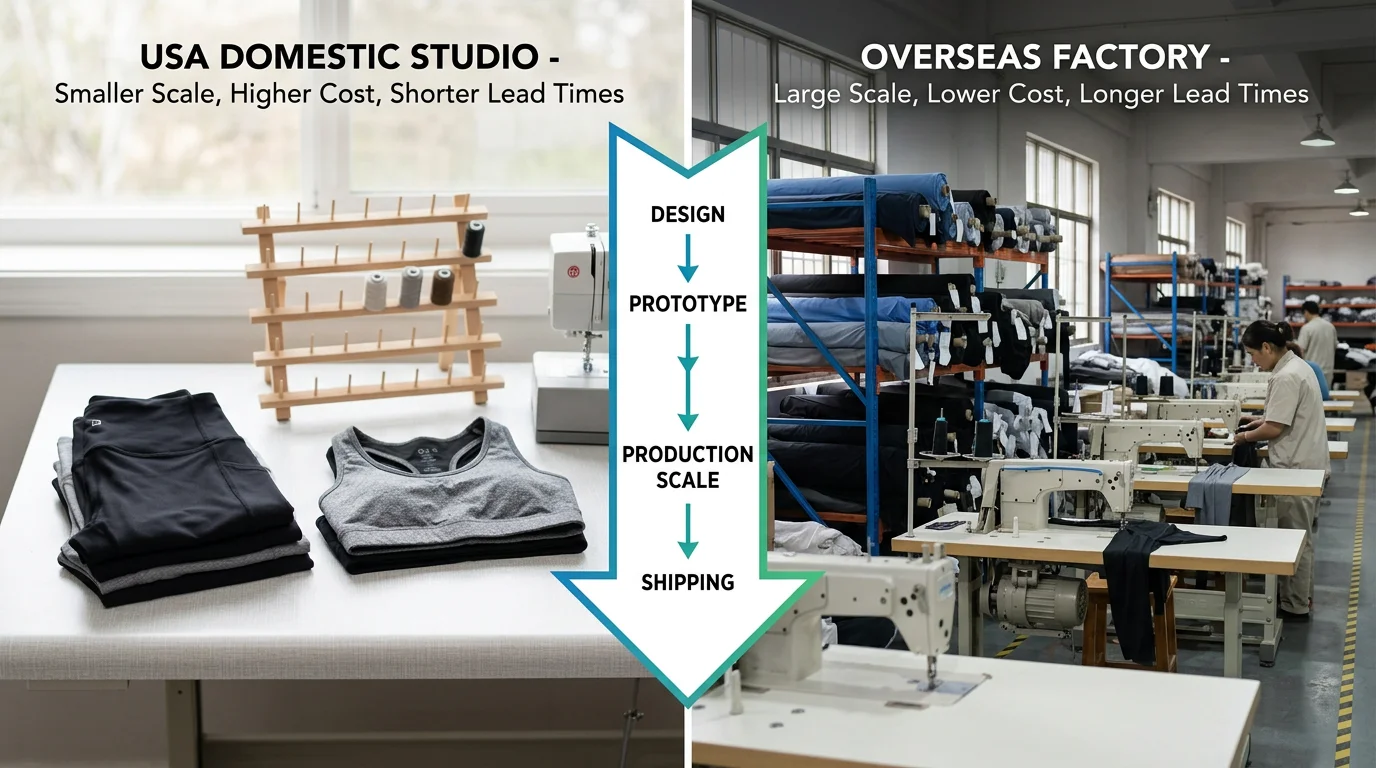
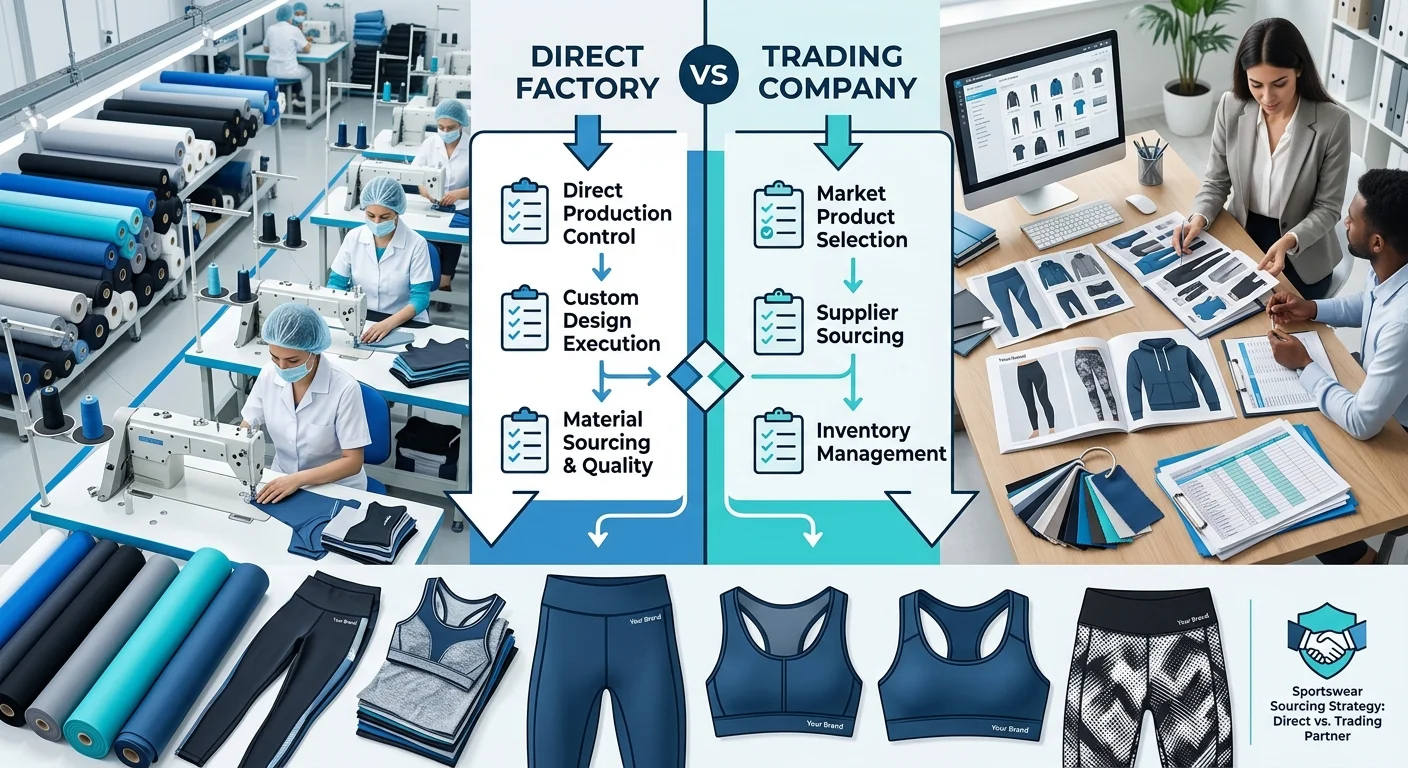
Choosing between OEM and ODM manufacturing might be the one decision that makes or breaks your activewear brand. Get it right, and you launch with profit. Get it wrong, and you burn cash before your first real sale.
Most founders make this call on gut instinct. Others rely on a supplier's pitch or half-understood advice from a Facebook group. That's a risky way to decide.
Here's the truth: these two models have different cost structures, different risk levels, and different growth limits. Where your brand stands today changes everything.
Tight startup budget? Your brand customization production costs will look very different under each model.
Scaling a DTC line? Choosing the wrong custom sportswear manufacturing partner can stall your growth fast.
This guide breaks down every dimension that matters. No guessing. Just clear information so you can build with confidence.
OEM vs ODM Cost Breakdown: Where the Real Money Goes
These numbers will surprise you — and they should change how you think about manufacturing costs.
Most brands compare OEM and ODM on unit price alone. That's a mistake. The real cost difference lives in three places: upfront development, minimum order thresholds, and the hidden cost of time. Miss any one of them and your cost model is broken before production starts.
Upfront Development: The Biggest Cost Gap
With OEM custom sportswear manufacturing , the brand pays for every dollar of development. Tech packs, sampling rounds, tooling, pattern-making — it all lands on your balance sheet. A complete OEM development cycle in apparel runs $5,000–$30,000 in tech pack and engineering costs alone. Add $200–$2,000 per sample round on top of that. All before a single unit ships.
ODM flips this model. The factory has already spread those costs across multiple clients. Your upfront exposure shrinks to minor customization fees — logo placement, colorways, packaging. That totals $1,000–$20,000 . Sampling is often free or capped at $100–$500 per round .
The result: ODM's upfront cash requirement is 5–20% of a comparable OEM project.
Unit Cost: Why Volume Is Everything
This is where the math gets interesting.
At 1,000 units , an OEM product with $100,000 in upfront investment and a $15 manufacturing cost carries a true unit cost of $115 . An ODM product at $22 per unit — already covering its share of factory R&D — wins by over 80%.
At 10,000 units , the gap narrows to 13%. At 100,000 units , OEM flips the advantage. It hits $16 per unit versus ODM's steady $22.
The crossover point matters. For private label activewear production, ODM holds the cost advantage until annual per-SKU volume exceeds 10,000 units. Or until annual SKU revenue crosses $50,000–$200,000 with consistent reorders.
The Hidden Cost Nobody Budgets For
ODM gets your white label fitness clothing to market in 1–3 months . OEM takes 6–18 months .
Say your market window is 12 months and OEM eats 9 months of that in development. You're not just delayed — you're losing sales. With a $10 net margin per unit and a 50,000-unit annual plan, that delay costs you $375,000 in unrealized profit . That figure is larger than most tech development budgets.
ODM carries its own risk, though. The same base design often ships to 5–10 different brands. Price wars follow. A product retailing at $29.99 with ~67% gross margin can slide to $14.99 with a 33% margin once competitors flood the same channel. OEM's product exclusivity keeps you out of that race.
The decision point in plain terms: Under 10,000 units per SKU, ODM protects your cash. Above that threshold — with proven demand — OEM pays back its upfront investment and builds the differentiation that protects your margins long-term.
MOQ, Inventory Risk & Cash Flow: A Side-by-Side Reality Check
The numbers in your manufacturing contract don't kill brands. The numbers behind the contract do.
MOQ, inventory exposure, and cash cycle — these are where most activewear founders get blindsided. The information isn't hidden. Nobody just puts it all in one place. Here it is.
MOQ: The First Cash Trap
OEM contract manufacturing apparel starts with a structural problem. You're not just paying a per-unit price. You're also absorbing tooling and development costs. Those costs force factories to set higher minimum order quantities to break even.
Take a product at $10/unit:
OEM (500-unit MOQ): $5,000 in inventory + ~$10,000 in development fees = $15,000 upfront per SKU
ODM (300-unit MOQ): $3,000 in inventory, no major tooling cost = $3,000 upfront per SKU
That's a $12,000 gap — per SKU. Scale that across five new SKUs in a year. You're looking at $75,000 tied up in OEM inventory versus $15,000 under ODM . For a bootstrapped activewear brand, that gap is a serious runway problem.
Inventory Risk: What Happens When a Product Doesn't Sell
ODM white label fitness clothing runs on shared platforms. The factory designs for broad demand. So a slow-moving SKU can be rebranded, repackaged, and redirected — often at a 30–50% discount through clearance channels. The product still holds some value.
OEM is the opposite. A custom-cut, brand-specific custom sportswear manufacturing product is built to your specs alone. No other brand wants it. No clearance buyer takes it at face value. You're looking at 70–90% markdowns to move it — or writing it off as a total loss.
The risk gap is real. ODM inventory gets a second life. OEM inventory does not.
Cash Flow Cycle: The Math That Determines Survival
ODM's activewear supply chain model puts real pressure on your cash cycle — in a good way. No design-from-scratch phase means a typical private label activewear production run moves from order to market in 3–4 months . Total cash tied up before first revenue: $16,500 (project costs + MOQ inventory).
OEM runs 6–9 months at minimum. Development overhead, sampling, QA, tooling — it all stacks up. You're looking at $96,400 locked before your first unit ships. That assumes $8,000/month in project costs, a $10,000 tooling fee, and initial inventory.
Same $100,000 in available working capital. Very different outcomes:
OEM: Funds one product launch per year, with cash sitting idle through the entire development window
ODM: Funds 4–6 parallel SKUs , each completing a full cash cycle in 5–6 months
That's not a small upgrade. That's a different product development manufacturing speed — and a much safer financial position for brands still testing what works.
The practical rule: Your working capital is under $50,000. Your minimum order quantity comparison puts OEM at 500+ units per SKU with tooling fees on top. In that case, ODM protects your cash flow and keeps your testing options open. Move to OEM once you have verified demand and a balance sheet that can handle a 9-month cash freeze.
Time to Market: How Each Model Affects Your Launch Strategy
Speed isn't a luxury in activewear. It's a competitive weapon — and OEM and ODM hand you very different ones.
The gap is significant. ODM gets a branded product to market in 1–3 months . OEM full development runs 12–18 months . That's not a scheduling difference. It's a completely different launch strategy.
The Real Cost of a 12-Month Development Cycle
A long development timeline hits your business in one very specific way.
Most retail buying windows lock in SKUs 4–6 months in advance . Miss that window, and you're waiting an entire season. With OEM, you're not building for this Black Friday or this spring fitness push — you're building for next year's, at best.
ODM removes that problem entirely. Pick a catalog design, add your logo, update the packaging. That process goes from brief to first shipment in 4–8 weeks for samples, 1–3 months total. That's the same window a trending social media product peaks and sells through.
Sampling Rounds: The Hidden Schedule Killer
OEM needs 3–5 sample revision rounds before production locks in. Each round covers engineering validation, structural refinement, pre-certification confirmation, and trial production. Each round adds 2–4 weeks . The sampling phase alone eats up 3–6 months of your timeline.
ODM cuts this down to 1–2 rounds . Each round takes 1–2 weeks . Total sampling time: 2–4 weeks . That one difference alone gives you at least 2 months of head start before mass production begins.
Matching Your Model to Your Market Window
Situation | Best Fit |
|---|---|
Launch window ≤ 3 months | ODM |
Holiday/promo event within 6 months | ODM |
Trend-driven SKU, peak life cycle < 6 months | ODM |
Evergreen core product, 3+ year lifespan | OEM |
Testing market before full investment | ODM first, OEM later |
The rule is simple: use ODM to capture the market, then use OEM to own it.
Start with a white label fitness clothing launch. Validate demand fast. Get reorder data. Build a proven customer base. Then invest the 12–18 months OEM requires — because by that point, you already know the product sells.
IP Ownership, Brand Differentiation & Long-Term Margin Potential
Here's a number most activewear founders never calculate: the margin ceiling gap between a brand built on owned IP versus shared factory designs is 20–30 gross margin percentage points . That gap compounds every year. You see it in your exit valuation, your pricing power, and your ability to hold price under competitive pressure.
This is where OEM and ODM split — and where the long-term cost question gets its real answer.
ODM's Hidden Ceiling: You're Sharing Your Moat
Under a standard ODM arrangement, the factory owns the base design. You own the logo. That distinction sounds minor. It isn't.
The same core product — same mold geometry, same technical specs, same BOM — ships to 3, 5, sometimes 10+ competing brands at the same time. On any major marketplace, consumers can run a direct side-by-side comparison. Once ratings and reviews level out across those listings, price becomes the only lever. Your white label fitness clothing line doesn't just compete with other brands. It competes with itself, copied under a dozen other logos.
The result is predictable:
- Gross margins hold at 30–40% on commodity ODM SKUs as price competition heats up
- Pricing power gets capped by the lowest-price reseller using the same factory base
- Your brand equity investment — every dollar you put into storytelling, photography, community — gets picked apart by competitors selling an identical product
Investors see this. ODM-heavy portfolios get flagged as low-moat, low-margin-ceiling businesses. The IP is often limited to trademarks. Those protect your name but do nothing to stop product-level price comparison.
OEM Exclusivity: How Design Ownership Translates to Pricing Power
OEM flips this equation. Your custom sportswear manufacturing contract includes clear ownership of design patents, trade dress, and proprietary specs. That gives you something ODM can never offer: legal separation from the commodity pool .
That separation has real, measurable value:
- Brands with exclusive OEM designs hold 20–50% price premiums over visually similar competitors
- Identical SKUs don't appear under competing brand names, so direct price comparison disappears
- Scale benefits go to you alone — no competitor can use your tooling
The long-term margin picture looks different too. Hero SKUs with strong IP ownership hit 50–70% gross margins in categories where design and brand drive purchase decisions. Once tooling and IP filing costs are paid off — usually by year 2–3 — the marginal cost per unit drops close to zero. Each unit sold past that breakeven point goes almost straight to margin.
What This Means for Your Exit Valuation
This isn't just an operational question. It's a valuation question.
Investors reviewing brand customization production cost models check three things to measure IP strength:
1. Granted patents and registered trademarks with documented renewals and global coverage
2. Exclusive OEM agreements with factory non-compete clauses that stop the same base design from shipping to competitors
3. A clear IP ownership trail — every design, every SKU, fully assigned to the brand entity
Unclear ownership triggers a valuation discount. Broad geographic coverage — U.S., EU, Asia — signals global scalability. Well-protected OEM portfolios support higher EBITDA multiples at exit. Buyers can model durable margins and lower commoditization risk with confidence.
ODM-only brands exit at lower multiples, full stop. The buyer sees a brand any competitor can copy with one phone call to the same factory.
The Practical Path: Protect What Earns
You don't need to file patents on every SKU. You need to be smart about which ones you protect.
For your product development manufacturing decisions, use this filter:
Find SKUs where more than 3 competitors share near-identical activewear factory designs on major marketplaces — those are your highest-risk ODM products
For your top 10–20% SKUs by profit contribution, lock in exclusive OEM tooling plus design IP ownership before scaling volume
File patents and trade dress registration in your top revenue markets for any SKU that brings in more than 10–15% of total revenue
Map gross margin percentage against IP protection level per SKU — the pattern will show you exactly where IP is holding up your pricing power
The bottom line: ODM builds a brand. OEM builds a moat. At early growth stage, starting with ODM for speed makes sense. Then move your highest-margin, fastest-moving SKUs to OEM with full IP ownership as demand proves out. That's how you protect the margins you worked to build.
Which Model Fits Your Brand Stage? (Decision Framework by Revenue & Goals)
Revenue stage is the one variable that matters here. Not your ambition. Not your brand vision. Not what your competitor is doing.
Founders who pick the wrong manufacturing model keep making the same mistake. They choose based on where they want to be, not where they are . That single misjudgment locks up capital, kills launch timelines, and turns a promising brand into a cautionary tale.
Here's the framework. Three stages. Clear thresholds. Specific numbers.
Stage 1: Startup — Annual Product Revenue Under $50K
Go 100% ODM. No exceptions.
At this stage, your job isn't to build a brand. Your job is to find out if you have a brand worth building. That means testing fast and failing cheap.
ODM makes that possible. OEM does not.
Here's the math. A single OEM mold runs $5,000–$20,000 per SKU . Commit to five molds at $8,000 each and you've burned $40,000 — about 80% of your entire annual revenue — before a single unit sells. A comparable ODM launch costs $0–$1,000 in development fees , and that's often bundled into the per-unit price.
The failure cost comparison makes this even clearer:
ODM test gone wrong: 200-unit order at $4 landed cost, liquidated at 50% discount → net loss ≈ $400
OEM bet gone wrong: 2,000-unit order at $3 plus $10,000 tooling, liquidated at 50% → net loss ≈ $13,000
One failed OEM SKU costs 32× more than one failed ODM test. For a brand under $50K revenue, that's not a setback. That's a full shutdown waiting to happen.
The practical play at this stage:
Launch 5–10 ODM test SKUs with MOQs of 100–500 units each
Target 50–200 units/month per SKU before treating anything as validated
Cut underperformers hard — a SKU not hitting 300 units/month by month 3 gets dropped
Keep less than 20–30% of total capital in inventory. Protect cash for marketing and operations
Don't touch OEM until a SKU hits:
- Consistent $3,000–$5,000/month revenue for 3–6 consecutive months
- Return rate under 5% and product rating above 4.2/5 on your main sales channel
ODM breakeven lands in 1–3 months of sales. OEM at small volumes takes 6–12+ months . At this stage, speed of learning is your real competitive edge.
Stage 2: Growth — Annual Revenue $50K–$200K
Run a hybrid model. OEM your winners. ODM your experiments.
By this point, your Pareto pattern has emerged. A handful of SKUs — 3–5 on average — are driving 60–80% of your revenue . Those are the ones worth protecting with OEM. Everything else stays on ODM.
The trigger for switching a SKU to OEM is simple: tooling payback under 12 months at your current run rate.
Work through it with real numbers:
- ODM unit cost: $5 → OEM unit cost: $4 → savings: $1/unit
- Volume: 1,000 units/month → gross margin improvement: $1,000/month
- Tooling cost: $8,000 → payback: 8 months
That SKU clears the threshold. Move it to OEM. Keep the rest in ODM.
The right portfolio mix at this stage:
SKU Category | Model | Revenue Share |
|---|---|---|
Top 2–3 validated SKUs | OEM | 50–70% |
10–20 test/experimental SKUs | ODM | 30–50% |
OEM gives you spec control — tighter materials, packaging, construction. That supports MSRP uplifts of 10–30% on your owned SKUs. ODM keeps your launch cadence high, with new styles hitting the market every 1–3 months .
The key discipline here is keeping the kill rule active on your ODM pipeline. Don't let slow-moving test SKUs pile up. They drain attention and tie up inventory capital you need to scale your OEM core.
Stage 3: Mature — Annual Revenue $200K+
Shift the entire core line to OEM. Use ODM for market probes only.
At $200K+ revenue with a clear path to $500K in the next 12–24 months , the financial case for full OEM is hard to argue against. Your top 5–20 SKUs — the ones driving 80–90% of revenue — should move to exclusive custom manufacturing.
The numbers tell the story:
Annual volume: 100,000 units
OEM savings vs ODM: $0.50–$1.50 per unit
Annual gross margin uplift: $50,000–$150,000
Total tooling across 10–20 SKUs: $50,000–$200,000
Payback period: 0.7–2.0 years
Projected payback on full tooling sits under 24 months . Your core SKUs show less than 10–15% annual sales decay . That makes the transition a clear financial call — not a judgment call.
Volume also hands you negotiating power that smaller brands don't have. Push $100,000–$500,000+ per year into one factory relationship and you can negotiate:
5–15% unit price reductions
Payment terms moving from 100% prepay to 30–60 day credit
Priority production slots and contractual exclusivity on tooling — once you commit to 20,000–50,000 units/SKU/year
ODM doesn't disappear at this stage. Its role just shifts. Use it for rapid market tests, limited seasonal runs, and accessory bundles. Keep its share of total revenue at under 20–30% .
The 3-Step Decision System
Stop overthinking the OEM vs ODM question. Run this process instead.
Step 1 — Check your trailing 12-month revenue
- Under $50K → Stage 1
- $50K–$200K → Stage 2
- Over $200K → Stage 3
Step 2 — Classify every SKU
- Test: Under $3K/month, limited data → ODM only
- Growth: $3K–$10K/month for 3–6+ months, repeat purchasing emerging → eligible for OEM
- Core: Over $10K/month, stable, consistent sales → must be OEM
Step 3 — Apply the model
- Stage 1: 100% ODM, MOQ 100–500 units, no tooling spend
- Stage 2: Top 2–3 SKUs to OEM with payback under 12 months; 10–20 SKUs remain in ODM
- Stage 3: All steady core SKUs to OEM; ODM capped at under 30% of revenue
The right model for your brand isn't the one that sounds most professional. It's the one that fits your actual revenue stage, keeps your cash position safe, and gives your best SKUs the protection they've already earned.
3 Costly Misconceptions About OEM and ODM Manufacturing Costs
Bad assumptions cost money. In activewear manufacturing, three specific misconceptions cost brands more than almost any other mistake — and they're hiding in plain sight.
Misconception #1: "OEM Always Costs More"
OEM starts more expensive. That part is true. Development, tooling, and sampling are real costs you absorb upfront. But "starts more expensive" is not the same as "costs more."
Here's the math that changes the picture:
OEM project: $200,000 in upfront R&D and tooling + $8/unit manufacturing cost
ODM alternative: $0 upfront + $10/unit (design costs baked into the price)
At 20,000 units , OEM costs $18/unit all-in. ODM wins at $10. Not close.
But at 200,000 units , OEM drops to $9/unit. ODM stays at $10. OEM is now 10% cheaper.
At 500,000 units, OEM hits $8.40. ODM is still $10. That's a 16% unit cost advantage. On top of that, scale efficiencies can push OEM manufacturing costs down another 5–15% as production matures.
For most custom sportswear manufacturing SKUs, there's a clear threshold. Once your total volume passes 30,000–50,000 units and the product lifespan runs longer than three years, OEM's upfront investment pays back. After that, it starts building a cost advantage that grows over time.
The takeaway: OEM isn't more expensive. It's more front-loaded . Those are two different problems entirely.
Misconception #2: "ODM Is the Budget-Friendly Option Long-Term"
ODM's low upfront cost is real. What happens to your margins 18 months later is also real — and nobody talks about it enough.
Here's how it plays out:
You launch a white label fitness clothing line on an ODM platform. Initial numbers look solid:
- Unit cost: $10
- Retail price: $25
- Channel and operating costs: $7/unit
- Gross margin: ~32%
Then three competing brands launch near-identical products from the same factory. One of them cuts price. Your retail price slides from $25 to $20. The factory drops your unit cost to $9 — but can't go further. Platform costs are shared and fixed.
New margin:
- $20 − $9 − $7 = $4/unit → gross margin ~20%
That's a 12-point margin compression . Profit down 37.5% . Not from a bad product decision. From a structural feature of how ODM platforms work.
Three signals that tell you this is happening to your brand:
1. Three or more brands on major marketplaces are selling near-identical designs from the same factory
2. Your category's average retail price has dropped 20–30% within 12–18 months
3. Your gross margin has fallen from 30–35% in year one to under 25% by year three — with no meaningful change in raw material costs
An OEM version of the same product — with a differentiated design and a $28 retail price — can hold 39% gross margins even after higher per-unit marketing spend. The 7-point margin gap sounds small. Run it across 100,000 units per year and that's $700,000 in extra gross profit.
The takeaway: ODM's "low cost" is a first-year number. The real cost shows up in your margins once the platform you're buying from starts selling to your competitors.
Misconception #3: "You Have to Pick One Model and Stick With It"
This might be the most damaging misconception of all. It pushes founders into an all-or-nothing decision that isn't necessary.
Mature activewear brands don't choose between OEM and ODM. They run both at the same time, matched to different SKU categories based on volume, margin contribution, and strategic priority.
A practical structure that works at scale:
SKU Category | Model | Typical Revenue Share |
|---|---|---|
Core differentiators (top 20% of SKUs) | OEM with exclusive tooling | 50–60% of gross margin |
Test launches and seasonal fills | ODM with light customization | 40–50% of gross margin |
The operational split looks like this:
- OEM SKUs: Target a 3–5 year lifecycle . These are your high-margin, IP-protected products. Annual new SKU launches through OEM: 20–30% of your pipeline
- ODM SKUs: Refresh every 12–24 months . These are your market probes, trend plays, and category expansion moves. 70–80% of new SKU launches
The move most brands miss: you can run both models through the same factory . A supplier that handles ODM platform production can also execute OEM custom tooling. Once an ODM SKU proves itself — consistent reorders, low returns, strong margin — you upgrade it. Commission independent tooling, adjust the design, and lock in exclusive production. The core structure stays, but the IP and pricing power now belong to you.
For a brand doing $10M in annual purchasing , this means putting 15–25% of your development budget toward OEM tooling and design, and 5–10% toward ODM customization. The rest flows into production. That's not two separate supply chains. That's one smart activewear supply chain model with two modes running in parallel.
The takeaway: The question was never OEM or ODM. The real question is which model fits which SKU — and building a system flexible enough to use both where each one wins.
FAQ: OEM vs ODM Cost-Effectiveness for Activewear Brands
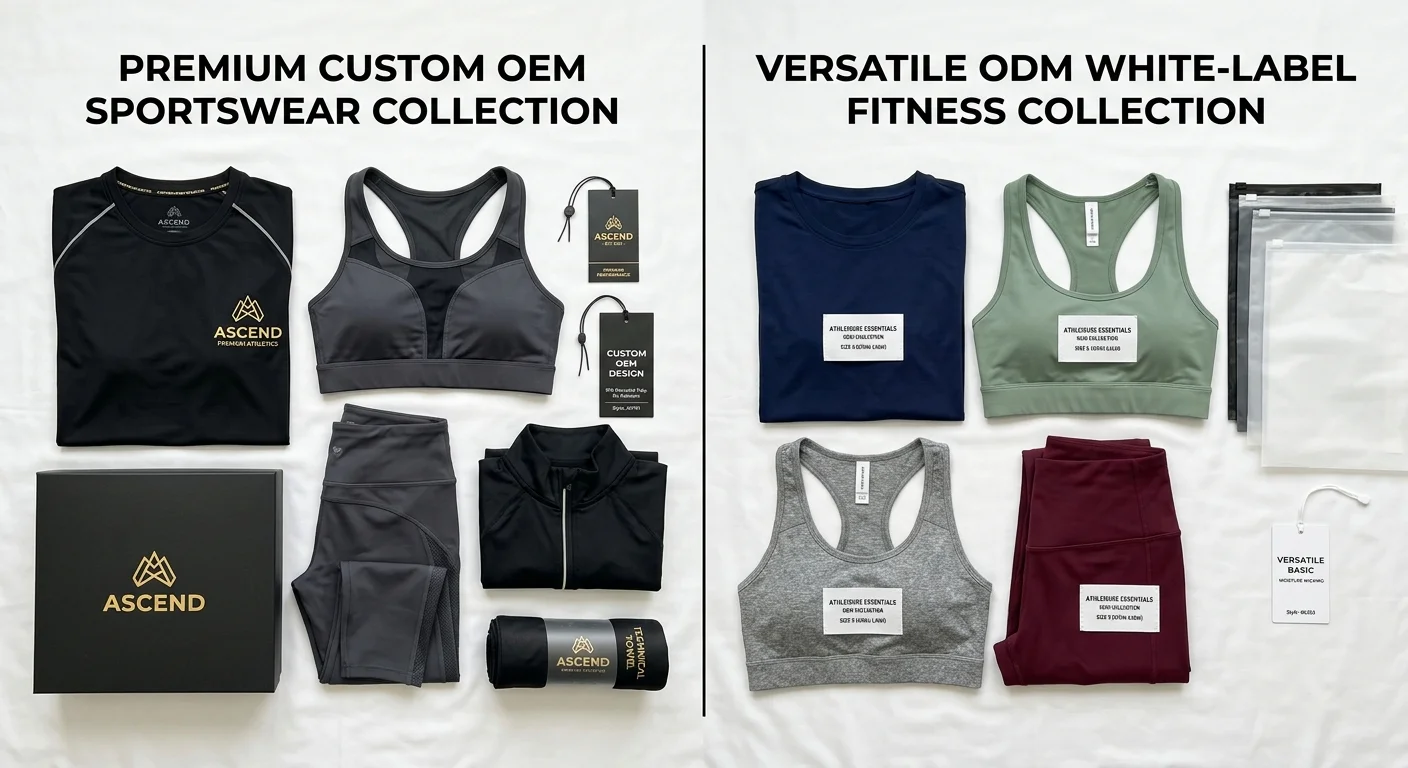
Ten questions. Real numbers. No fluff.
Q1: Which model has the lower MOQ?
ODM wins. OEM requires 500–1,000+ pcs per style . ODM runs 100–500 pcs . Basic private-label (logo on stock styles) drops as low as 50–200 pcs .
Q2: Which is cheaper upfront?
ODM by a wide margin. OEM development per style costs $1,000–$3,000 before bulk. ODM? $0–$500 . You get existing patterns, no grading cost, and one confirmation sample often included free. That puts pre-production costs 50–80% lower .
Q3: How do unit costs compare?
OEM ex-factory sits at $7–$18/unit . ODM ex-factory runs $6–$14/unit at 100–500 pcs. The price gap closes fast above 2,000 units.
Q4: At what volume does OEM become more cost-effective?
- Under 500 pcs/year → ODM
- 500–1,500 pcs/year → borderline. OEM wins only if you charge ≥20% higher retail
- Above 1,500–2,000 pcs/year → OEM wins long-term
Q5: Which model drives higher long-term profit?
OEM. Exclusive designs let you charge 20–40% higher retail prices . You sell more at full price. Plus, you face fewer margin-killing competitors on identical SKUs.
Q6: Can ODM work for premium activewear?
Up to a point. Good ODM factories now offer nylon-spandex 220–280gsm fabric with moisture-wicking and squat-proof builds. The real ceiling sits at ≤$80 per bottom, ≤$60 per bra . Go above that price point, or target technical performance niches, and OEM is the right call.
Q7: Can one factory run both OEM and ODM? Yes — and it's common. Most Asia-Pacific Sportswear Manufacturers run OEM, ODM, and private-label lines at the same time. OEM clients get brand-specific patterns. ODM clients share house patterns.
Q8: Which model gets to market faster?
ODM launches in 6–10 weeks total. OEM takes 13–20 weeks . So ODM gets you to market 40–60% faster — a real edge for brands launching on Amazon or Shopify.
Q9: Where should cost-sensitive brands source?
Asia-Pacific. The region handles ~ 45% of global OEM/ODM clothing output . Top manufacturers control over 50% of that volume. This gives ODM clients direct access to economies of scale that North America and Europe can't match on price.
Q10: What's the one-line decision rule?
ODM to validate. OEM to dominate.
Conclusion
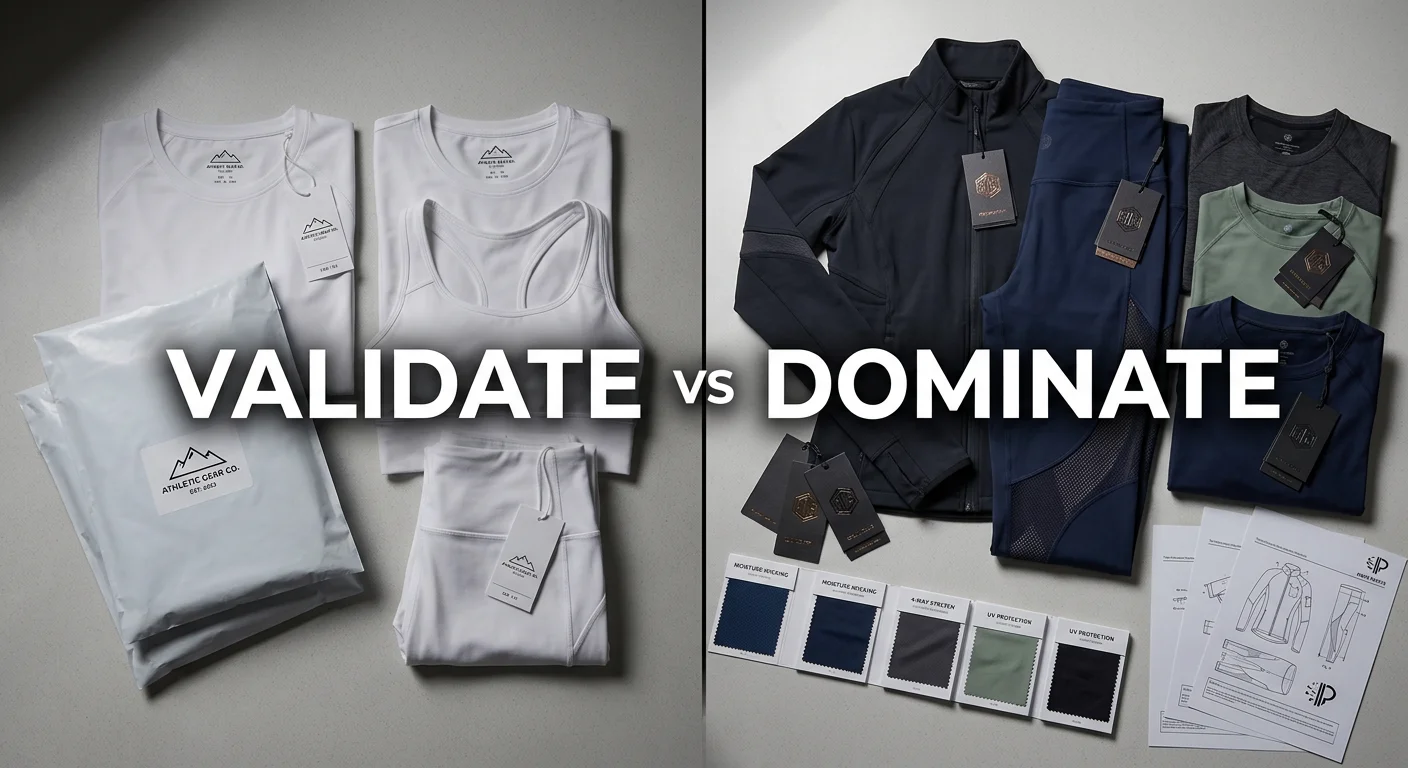
The OEM vs ODM decision isn't about which model is "better." It's about which model is right for where your brand stands today .
Launching lean? ODM gets you to market faster with lower upfront investment. Scaling a differentiated brand with long-term margin goals? OEM's custom sportswear manufacturing path builds a moat that competitors can't cross.
Both models work. Both carry real costs beyond the price tag — in time, inventory risk, IP control, and brand equity.
Here's what most successful activewear founders do: stop guessing, start talking to the right manufacturer.
At Berun Activewear , we work with brands at every stage. That includes first-time founders figuring out minimum order quantities and growing DTC labels reworking their activewear production model. Tell us where you are. We'll show you which path makes financial sense.
Your next step is one conversation away. Get your free quote →